Home About Chat Users Issues Party Candidates Polling Firms Media News Polls Calendar Key Races United States President Senate House Governors International

New User Account
"A comprehensive, collaborative elections resource." 
Email: Password:

  OH - District 06 - History
House of Representatives DETAILS
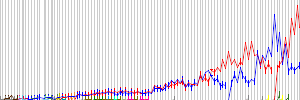
Parents > United States > Ohio > OH - District 06   Raw Vote Total:

Percentages:

Website
Established January 03, 1813
Disbanded Still Active
Last ModifiedRP April 28, 2011 11:30pm
Description

RACES [Show Primaries]
Redistricting: Light Green=Added Territory, Red=Removed Territory,
Dark Green=Kept Territory
Date Type Results
Nov 05, 2024 General Election
 Michael L. Kripchak
0
0.00%
 Michael A. Rulli
0
0.00%
Jun 11, 2024 Special Election
 Michael A. Rulli
0
0.00%
 Michael L. Kripchak
0
0.00%
Nov 08, 2022 General Election
 Bill Johnson(I)
189,883
67.72%
 Louis Lyras
90,500
32.28%
Date Type Results
Nov 03, 2020 General Election
 Bill Johnson(I)
249,130
74.41%
 Shawna A. Roberts
85,661
25.59%
Nov 06, 2018 General Election
 Bill Johnson(I)
172,774
69.25%
 Shawna A. Roberts
76,716
30.75%
Nov 08, 2016 General Election
 Bill Johnson(I)
213,975
70.68%
 Mike Lorentz
88,780
29.32%
Nov 04, 2014 General Election
 Bill Johnson(I)
111,026
58.23%
 Jennifer Garrison
73,561
38.58%
 Dennis Lambert
6,065
3.18%
Nov 06, 2012 General Election
 Bill Johnson(I)
164,536
53.25%
 Charlie Wilson
144,444
46.75%
Date Type Results
Nov 02, 2010 General Election
 Bill Johnson
103,170
50.19%
 Charlie Wilson(I)
92,823
45.15%
 Richard Cadle
5,077
2.47%
 Martin Elsass
4,505
2.19%
Nov 04, 2008 General Election
 Charlie Wilson(I)
176,330
62.28%
 Richard Stobbs
92,968
32.84%
 Dennis Spisak
13,812
4.88%
Nov 07, 2006 General Election
 Charlie Wilson
135,628
62.08%
 Charles R. "Chuck" Blasdel
82,848
37.92%
Nov 02, 2004 General Election
 Ted Strickland(I)
223,842
99.94%
 John Stephen Luchansky (W)
145
0.06%
Nov 05, 2002 General Election
 Ted Strickland(I)
113,972
59.48%
 Mike Halleck
77,643
40.52%
Date Type Results
Nov 07, 2000 General Election
 Ted Strickland(I)
138,849
57.72%
 Mike Azinger
96,966
40.31%
 Kenneth R. MacCutcheon
4,759
1.98%
Nov 03, 1998 General Election
 Ted Strickland(I)
102,852
56.96%
 Nancy Hollister
77,711
43.04%
Nov 05, 1996 General Election
 Ted Strickland
118,003
51.32%
 Frank A. Cremeans(I)
111,907
48.67%
 Jane Ann Berndt (W)
16
0.01%
Nov 08, 1994 General Election
 Frank A. Cremeans
91,263
50.95%
 Ted Strickland(I)
87,861
49.05%
Nov 03, 1992 General Election
 Ted Strickland
122,720
50.72%
 Bob McEwen(I)
119,252
49.28%
Date Type Results
Nov 06, 1990 General Election
 Bob McEwen(I)
117,220
71.20%
 Ray Mitchell
47,415
28.80%
Nov 08, 1988 General Election
 Bob McEwen(I)
152,235
74.31%
 Gordon R. Roberts
52,635
25.69%
Nov 04, 1986 General Election
 Bob McEwen(I)
106,354
70.28%
 Gordon R. Roberts
42,155
27.85%
 Amos Seeley
2,829
1.87%
Date Type Results
Nov 06, 1984 General Election
 Bob McEwen(I)
150,101
74.00%
 Bob Smith
52,727
26.00%
Nov 02, 1982 General Election
 Bob McEwen(I)
92,135
59.22%
 Lynn Allen Grimshaw
63,435
40.78%
Date Type Results
Nov 04, 1980 General Election
 Bob McEwen
101,288
54.60%
 Ted Strickland
84,235
45.40%
Nov 07, 1978 General Election
 William H. Harsha, Jr.(I)
85,592
64.89%
 Ted Strickland
46,318
35.11%
Nov 02, 1976 General Election
 William H. Harsha, Jr.(I)
107,064
61.48%
 Ted Strickland
67,067
38.52%
Nov 05, 1974 General Election
 William H. Harsha, Jr.(I)
93,400
68.82%
 Lloyd Allan Wood
42,316
31.18%
Nov 07, 1972 General Election
 William H. Harsha, Jr.(I)
128,394
100.00%
Date Type Results
Nov 03, 1970 General Election
 William H. Harsha, Jr.(I)
82,772
67.83%
 Raymond H. Stevens
39,265
32.17%
Nov 05, 1968 General Election
 William H. Harsha, Jr.(I)
107,289
72.37%
 Kenneth L. Kirby
40,964
27.63%
Date Type Results
Nov 08, 1966 General Election
 William H. Harsha, Jr.(I)
74,847
67.92%
 Ottie W. Reno, Sr.
35,345
32.08%
Date Type Results
Nov 03, 1964 General Election
 William H. Harsha, Jr.(I)
86,015
60.05%
 Franklin E. Smith
57,223
39.95%
Nov 06, 1962 General Election
 William H. Harsha, Jr.(I)
72,743
60.38%
 Jerry Carmel Rasor
47,737
39.62%
Nov 08, 1960 General Election
 William H. Harsha, Jr.
80,124
55.19%
 Franklin E. Smith
65,045
44.81%
Nov 08, 1960 Special Election
 Ward M. Miller
76,520
55.36%
 Gladys E. Davis
61,713
44.64%
Nov 04, 1958 General Election
 James G. Polk(I)
76,566
62.00%
 Elmer S. Barrett
46,924
38.00%
Nov 06, 1956 General Election
 James G. Polk(I)
72,229
54.50%
 Albert L. Daniels
60,300
45.50%
Nov 02, 1954 General Election
 James G. Polk(I)
54,044
52.18%
 Leo Blackburn
49,531
47.82%
Nov 04, 1952 General Election
 James G. Polk(I)
67,220
50.12%
 Leo Blackburn
66,896
49.88%
Date Type Results
Nov 07, 1950 General Election
 James G. Polk(I)
40,335
50.84%
 Edward O. McCowen
38,996
49.16%
Nov 02, 1948 General Election
 James G. Polk
46,944
53.08%
 Edward O. McCowen(I)
41,492
46.92%
Nov 05, 1946 General Election
 Edward O. McCowen(I)
39,992
54.78%
 Franklin E. Smith
33,013
45.22%
Nov 07, 1944 General Election
 Edward O. McCowen(I)
45,284
51.78%
 John W. Bush
42,167
48.22%
Nov 03, 1942 General Election
 Edward O. McCowen
33,171
51.06%
 Jacob E. Davis(I)
31,793
48.94%
Nov 05, 1940 General Election
 Jacob E. Davis
52,769
52.23%
 Chester P. Fitch
48,257
47.77%
Nov 08, 1938 General Election
 James G. Polk(I)
43,646
50.46%
 Emory F. Smith
42,847
49.54%
Nov 03, 1936 General Election
 James G. Polk(I)
54,904
54.56%
 Emory F. Smith
45,733
45.44%
Nov 06, 1934 General Election
 James G. Polk(I)
42,340
52.15%
 Albert L. Daniels
38,538
47.47%
 Mark A. Crawford
312
0.38%
Nov 08, 1932 General Election
 James G. Polk(I)
50,913
56.21%
 Mack Sauer
39,668
43.79%
Nov 04, 1930 General Election
 James G. Polk
37,158
52.74%
 Charles C. Kearns(I)
33,300
47.26%
Nov 06, 1928 General Election
 Charles C. Kearns(I)
43,519
56.86%
 George D. Nye
33,020
43.14%
Nov 02, 1926 General Election
 Charles C. Kearns(I)
27,688
52.92%
 Edward H. Kennedy
24,630
47.08%
Nov 04, 1924 General Election
 Charles C. Kearns(I)
33,064
53.03%
 Edward H. Kennedy
29,283
46.97%
Nov 07, 1922 General Election
 Charles C. Kearns(I)
32,416
52.83%
 William N. Gableman
28,939
47.17%
Nov 02, 1920 General Election
 Charles C. Kearns(I)
38,044
55.18%
 Cleona Searles
30,903
44.82%
Nov 05, 1918 General Election
 Charles C. Kearns(I)
18,592
52.84%
 A. G. Turnipseed
16,591
47.16%
Nov 07, 1916 General Election
 Charles C. Kearns(I)
21,315
49.62%
 A. G. Turnipseed
20,811
48.45%
 W. Bagby
830
1.93%
Nov 03, 1914 General Election
 Charles C. Kearns
19,456
50.57%
 William A. Inman
17,766
46.18%
 Fred D. Lauderman
1,164
3.03%
 W. D. Gilliland
86
0.22%
Date Type Results
Nov 05, 1912 General Election
 Simeon D. Fess
18,090
49.19%
 D. K. Hempstead
17,300
47.04%
 G. D. Vandervort
1,384
3.76%
Nov 08, 1910 General Election
 Matthew R. Denver(I)
20,056
53.96%
 Jesse Taylor
17,105
46.02%
 Jonah Vandervort
4
0.01%
Nov 03, 1908 General Election
 Matthew R. Denver(I)
23,192
51.55%
 Jesse Taylor
21,592
47.99%
 B. D. Hypes
206
0.46%
Nov 06, 1906 General Election
 Matthew R. Denver
17,471
50.62%
 Charles Q. Hildebrant
16,291
47.20%
 Edward J. Meacham
445
1.29%
 Joseph H. Sims
310
0.90%
Nov 08, 1904 General Election
 Thomas E. Scroggy
21,485
51.37%
 James A. Runyan
19,148
45.78%
 George Dodds
775
1.85%
 Joseph H. Sims
418
1.00%
Nov 04, 1902 General Election
 Charles Q. Hildebrant(I)
19,609
55.05%
 William G. Thompson
15,188
42.64%
 E. T. Hays
612
1.72%
 Frederick G. Strickland
214
0.60%
Date Type Results
Nov 06, 1900 General Election
 Charles Q. Hildebrant
24,610
54.22%
 Adam Bridge
20,407
44.96%
 Walter S. Rudisill
371
0.82%
Nov 08, 1898 General Election
 Seth W. Brown(I)
19,896
53.97%
 Lewis H. Whiteman
16,206
43.96%
 Perry McLaughlin
761
2.06%
Nov 03, 1896 General Election
 Seth W. Brown
25,360
53.90%
 Harry W. Paxton
21,358
45.39%
 Frank S. Delo
336
0.71%
Nov 06, 1894 General Election
 George Washington Hulick(I)
20,283
57.30%
 Joseph L. Stephens
12,505
35.32%
 Seth H. Ellis
1,419
4.01%
 C. N. Puke
1,193
3.37%
Nov 08, 1892 General Election
 George Washington Hulick
21,341
51.44%
 John M. Pattison(I)
18,091
43.60%
 Alva Crabtree
1,374
3.31%
 Charles B. Edwards
684
1.65%
Date Type Results
Nov 04, 1890 General Election
 Dennis D. Donovan
18,741
50.96%
 Joseph H. Brigham
17,029
46.31%
 W. A. Corkle
1,005
2.73%
Date Type Results
Nov 06, 1888 General Election
 Melvin M. Boothman(I)
22,434
48.50%
 Gaylard M. Saltzgaber
22,339
48.29%
 Alonzo B. Leonard
1,367
2.96%
 James M. Barbour
120
0.26%
Nov 02, 1886 General Election
 Melvin M. Boothman
19,476
50.04%
 William D. Hill(I)
18,099
46.50%
 John W. Roseborough
1,345
3.46%
Date Type Results
Oct 14, 1884 General Election
 William D. Hill(I)
20,684
54.10%
 Hiram C. Green
17,154
44.87%
 Nathaniel Crary
317
0.83%
 M. H. Hayes
77
0.20%
Date Type Results
Oct 10, 1882 General Election
 William D. Hill
16,201
49.67%
 Joseph H. Brigham
15,480
47.46%
 George Loutzenheiser
510
1.56%
 E. T. Hayes
426
1.31%
Date Type Results
Oct 12, 1880 General Election
 James M. Ritchie
19,773
49.37%
 Frank H. Hurd(I)
19,097
47.69%
 Benjamin F. Miller
1,038
2.59%
 D. N. Trobridge
139
0.35%
Date Type Results
Oct 08, 1878 General Election
 William D. Hill
16,110
52.43%
 James L. Price
12,072
39.29%
 William C. Holgate
2,544
8.28%
Date Type Results
Oct 10, 1876 General Election
 Jacob D. Cox
17,276
50.04%
 Frank H. Hurd(I)
15,361
44.49%
 E. B. Hall
1,887
5.47%
Oct 13, 1874 General Election
 Frank H. Hurd
13,108
51.90%
 Albert M. Pratt
11,271
44.63%
 Francis Granger
875
3.46%
Oct 08, 1872 General Election
 Isaac R. Sherwood
13,471
51.94%
 Frank H. Hurd
12,406
47.83%
 Henry Moores
59
0.23%
Date Type Results
Oct 11, 1870 General Election
 John A. Smith(I)
12,063
49.81%
 James W. Denver
11,827
48.84%
 D. W. Louden
326
1.35%
Oct 13, 1868 General Election
 John A. Smith
13,463
50.65%
 Nelson Barrere
13,120
49.35%
Oct 09, 1866 General Election
 Reader W. Clarke(I)
13,846
53.02%
 William Howard
12,267
46.98%
Oct 10, 1864 General Election
 Reader W. Clarke
12,662
55.21%
 Chilton A. White(I)
10,274
44.79%
Oct 14, 1862 General Election
 Chilton A. White(I)
10,087
51.98%
 Robert M. Briggs
9,320
48.02%
Date Type Results
Oct 09, 1860 General Election
 Chilton A. White
10,046
53.23%
 David H. Murphy
8,828
46.77%
Oct 12, 1858 General Election
 William Howard
7,792
51.58%
 Reader W. Clarke
6,922
45.82%
 William R. Arthur
394
2.61%
Oct 14, 1856 General Election
 Joseph R. Cockerill
8,603
48.71%
 Jonas R. Emrie(I)
7,460
42.24%
 John A. Trimble
1,598
9.05%
Oct 10, 1854 General Election
 Jonas R. Emrie
9,990
65.04%
 Andrew Ellison(I)
5,370
34.96%
Oct 12, 1852 General Election
 Andrew Ellison
7,481
50.57%
 Nelson Barrere(I)
7,208
48.73%
 S. H. Chase
103
0.70%
Date Type Results
Dec 23, 1850 Special Election
 John Bell
1,526
81.69%
  Scattering
342
18.31%
Oct 08, 1850 General Election
 Frederick W. Green
7,224
92.23%
 John C. Spink
609
7.77%
Oct 09, 1849 Special Election
 Amos E. Wood
4,611
86.61%
 D. B. White
713
13.39%
Oct 10, 1848 General Election
 Rodolphus Dickinson(I)
7,404
58.82%
 Cooper K. Watson
5,184
41.18%
Oct 13, 1846 General Election
 Rodolphus Dickinson
5,802
57.23%
 Eli Dresback
4,159
41.02%
 Joseph Jackson
177
1.75%
Date Type Results
Oct 08, 1844 General Election
 Henry St. John(I)
6,975
56.77%
 Abel Rawson
5,278
42.96%
 Cooper K. Watson
33
0.27%
Oct 10, 1843 General Election
 Henry St. John
4,367
97.24%
  Scattering
81
1.80%
 Lowell Robinson
43
0.96%
Date Type Results
Oct 13, 1840 General Election
 Calvary Morris(I)
8,724
55.90%
 George House
6,882
44.10%
Oct 09, 1838 General Election
 Calvary Morris(I)
5,321
55.09%
 Joseph Morris
4,337
44.91%
Oct 11, 1836 General Election
 Calvary Morris
3,780
50.37%
 Nahum Ward
3,703
49.34%
 Arius Nye
22
0.29%
Oct 14, 1834 General Election
 Samuel Finley Vinton(I)
3,819
62.24%
 Thomas M. Drake
1,603
26.12%
 A. V. Jolline
714
11.64%
Oct 09, 1832 General Election
 Samuel Finley Vinton(I)
3,593
63.27%
 George House
2,086
36.73%
Date Type Results
Oct 12, 1830 General Election
 William Creighton(I)
3,360
54.21%
 Valentine Keffer
2,838
45.79%
Date Type Results
Dec 02, 1828 Special Election
 Francis Muhlenberg
445
47.64%
 Cadwallader Wallace
405
43.36%
 John Thomson
84
8.99%
Oct 14, 1828 General Election
 William Creighton(I)
3,097
50.24%
 Cadwallader Wallace
3,068
49.76%
Oct 10, 1826 General Election
 William Creighton
3,653
63.52%
 John Thomson(I)
2,098
36.48%
Oct 12, 1824 General Election
 John Thomson
3,138
55.97%
 Duncan McArthur(I)
2,469
44.03%
Oct 08, 1822 General Election
 Duncan McArthur
1,331
27.69%
 Henry Brush
922
19.18%
 Edward King
829
17.25%
 Caleb Atwater
785
16.33%
 Richard Douglass
583
12.13%
 Thomas Scott
357
7.43%
Date Type Results
Oct 10, 1820 General Election
 John Sloane(I)
10,842
91.74%
 Alfred Kelly
963
8.15%
  Scattering
13
0.11%
Oct 13, 1818 General Election
 John Sloane
4,208
51.71%
 Peter Hitchcock(I)
3,758
46.18%
 Benjamin Martin
171
2.10%
Oct 08, 1816 General Election
 Peter Hitchcock
3,047
57.50%
 Joseph Richardson
1,487
28.06%
 John G. Young
453
8.55%
 David Clendenin(I)
312
5.89%
Oct 11, 1814 Special Election
 David Clendenin
1,244
64.02%
 Lewis Kinney
342
17.60%
 John G. Young
238
12.25%
 Thomas G. Jones
119
6.12%
Oct 11, 1814 General Election
 David Clendenin
984
55.66%
 Lewis Kinney
437
24.72%
 John G. Young
269
15.21%
 Thomas G. Jones
78
4.41%
Apr 20, 1813 Special Election
 Reasin Beall
20
54.05%
 Simon Perkins
17
45.95%
Oct 13, 1812 General Election
 John S. Edwards
1,968
60.37%
 Reasin Beall
1,258
38.59%
  Scattering
34
1.04%

DISCUSSION
[Download as CSV]