Home About Chat Users Issues Party Candidates Polling Firms Media News Polls Calendar Key Races United States President Senate House Governors International

New User Account
"A comprehensive, collaborative elections resource." 
Email: Password:

  OK - District 05 - History
House of Representatives DETAILS
Parents > United States > Oklahoma > OK - District 05   Raw Vote Total:

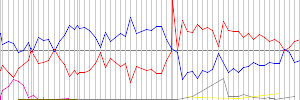
Percentages:

Website
Established December 02, 1907
Disbanded Still Active
Last ModifiedRBH March 11, 2012 11:07pm
Description

RACES [Show Primaries]
Redistricting: Light Green=Added Territory, Red=Removed Territory,
Dark Green=Kept Territory
Date Type Results
Nov 05, 2024 General Election
  Stephanie Bice(I)
207,636
60.69%
  Madison Horn
134,471
39.31%
Nov 08, 2022 General Election
  Stephanie Bice(I)
152,699
59.00%
  Joshua Harris-Till
96,799
37.40%
  David K. Frosch
9,328
3.60%
Date Type Results
Nov 03, 2020 General Election
  Stephanie Bice
158,191
52.06%
  Kendra Horn(I)
145,658
47.94%
Nov 06, 2018 General Election
  Kendra Horn
121,149
50.70%
  Steve Russell(I)
117,811
49.30%
Nov 08, 2016 General Election
  Steve Russell(I)
160,184
57.09%
  Al McAffrey
103,273
36.81%
  Zachary Knight
17,113
6.10%
Nov 04, 2014 General Election
  Steve Russell
95,632
60.10%
  Al McAffrey
57,790
36.32%
  Robert T. Murphy
2,176
1.37%
  Tom Boggs
2,065
1.30%
  Buddy Ray
1,470
0.92%
Nov 06, 2012 General Election
  James Lankford(I)
153,603
58.70%
  Tom Guild
97,504
37.26%
  Pat Martin
5,394
2.06%
  Robert T. Murphy
5,176
1.98%
Date Type Results
Nov 02, 2010 General Election
  James Lankford
123,236
62.52%
  Billy Coyle
68,074
34.54%
  Clark W. Duffe
3,067
1.56%
  Dave White
2,728
1.38%
Nov 04, 2008 General Election
  Mary Fallin(I)
171,925
65.89%
  Steven L. Perry
88,996
34.11%
Nov 07, 2006 General Election
  Mary Fallin
108,936
60.38%
  David Hunter
67,293
37.30%
  Matthew Woodson
4,196
2.33%
Nov 02, 2004 General Election
  Ernest J. Istook, Jr.(I)
180,430
66.06%
  Bert Smith
92,719
33.94%
Nov 05, 2002 General Election
  Ernest J. Istook, Jr.(I)
121,374
62.23%
  Lou Barlow
63,208
32.41%
  Donna Davis
10,469
5.37%
Date Type Results
Nov 07, 2000 General Election
  Ernest J. Istook, Jr.(I)
134,159
68.44%
  Garland McWatters
53,275
27.18%
  Bill Maguire
5,930
3.03%
  Robert T. Murphy
2,658
1.36%
Nov 03, 1998 General Election
  Ernest J. Istook, Jr.(I)
103,217
68.18%
  M. C. Smothermon
48,182
31.82%
Nov 05, 1996 General Election
  Ernest J. Istook, Jr.(I)
148,362
69.72%
  James L. Forsythe
57,594
27.07%
  Ava Kennedy
6,835
3.21%
Nov 08, 1994 General Election
  Ernest J. Istook, Jr.(I)
136,877
78.15%
  Tom Keith
38,270
21.85%
Nov 03, 1992 General Election
  Ernest J. Istook, Jr.
123,237
53.39%
  Laurie Williams
107,579
46.61%
Date Type Results
Nov 06, 1990 General Election
  Mickey Edwards(I)
114,608
69.59%
  Bryce Baggett
50,086
30.41%
Nov 08, 1988 General Election
  Mickey Edwards(I)
139,182
72.17%
  Terry J. Montgomery
53,668
27.83%
Nov 04, 1986 General Election
  Mickey Edwards(I)
108,774
70.62%
  Donna Compton
45,256
29.38%
Nov 06, 1984 General Election
  Mickey Edwards(I)
135,167
75.63%
  Allen Greeson
39,089
21.87%
  D. Frank Robinson
4,470
2.50%
Nov 02, 1982 General Election
  Mickey Edwards(I)
98,979
67.24%
  Dan Lane
42,453
28.84%
  Paul E. Trent
5,777
3.92%
Date Type Results
Nov 04, 1980 General Election
  Mickey Edwards(I)
90,053
68.43%
  David Hood
36,815
27.98%
  James Rushing
4,722
3.59%
Nov 07, 1978 General Election
  Mickey Edwards(I)
71,451
79.90%
  Jesse Dennis Knipp
17,978
20.10%
Nov 02, 1976 General Election
  Mickey Edwards
78,651
49.85%
  Tom Dunlap
74,752
47.38%
  Max Wolfley
1,353
0.86%
  Donald F. Parker
1,348
0.85%
  Jim Smith
886
0.56%
  Robert "Bob" Buchanan
774
0.49%
Jan 24, 1975 Party Switch
  John Jarman(I)
1
100.00%
Nov 05, 1974 General Election
  John Jarman(I)
52,107
51.69%
  Mickey Edwards
48,705
48.31%
Nov 07, 1972 General Election
  John Jarman(I)
69,710
60.40%
  Llewelyn L. Keller II
45,711
39.60%
Date Type Results
Nov 03, 1970 General Election
  John Jarman(I)
62,034
73.12%
  Terry L. Campbell
22,801
26.88%
Nov 05, 1968 General Election
  John Jarman(I)
86,420
73.64%
  Bob Leeper
30,931
26.36%
Date Type Results
Nov 08, 1966 General Election
  John Jarman(I)
96,464
69.62%
  Melvin H. Gragg
42,088
30.38%
Nov 03, 1964 General Election
  John Jarman(I)
130,014
70.81%
  Homer Cowan
53,596
29.19%
Nov 06, 1962 General Election
  John Jarman(I)
90,392
68.89%
  William P. Pointon, Jr.
40,825
31.11%
Nov 08, 1960 General Election
  John Jarman(I)
125,286
66.55%
  Hobart H. Hobbs
62,971
33.45%
Nov 04, 1958 General Election
  John Jarman(I)
79,917
82.34%
  Hobart H. Hobbs
17,137
17.66%
Nov 06, 1956 General Election
  John Jarman(I)
110,416
63.74%
  Hobart H. Hobbs
62,812
36.26%
Nov 02, 1954 General Election
  John Jarman(I)
72,380
66.04%
  George E. Young
37,223
33.96%
Nov 04, 1952 General Election
  John Jarman(I)
128,627
62.42%
  Edwin Whitney Burch
77,425
37.58%
Date Type Results
Nov 07, 1950 General Election
  John Jarman
72,877
58.83%
  C. E. Barnes
51,008
41.17%
Nov 02, 1948 General Election
  Mike Monroney(I)
95,248
67.44%
  Carmon C. Harris
45,985
32.56%
Nov 05, 1946 General Election
  Mike Monroney(I)
47,173
52.02%
  Carmon C. Harris
43,508
47.98%
Nov 07, 1944 General Election
  Mike Monroney(I)
85,132
62.70%
  Howard B. Hopps
50,207
36.98%
  Cora C. Schott
431
0.32%
Nov 03, 1942 General Election
  Mike Monroney(I)
36,736
69.69%
  George W. Colvert
15,738
29.85%
  Lizzie Varvil
241
0.46%
Nov 05, 1940 General Election
  Mike Monroney(I)
93,457
72.36%
  Ulysses S. Stone
34,942
27.06%
  Lizzie Varvil
566
0.44%
  John Franing
183
0.14%
Nov 08, 1938 General Election
  Mike Monroney
47,692
71.93%
  Harlan Deupree
18,271
27.56%
  Lizzie Varvil
336
0.51%
Dec 10, 1937 Special Election
  Gomer Smith
21,131
74.52%
  Harlan Deupree
7,132
25.15%
  Bruno H. Miller
42
0.15%
  C. T. Hassman
36
0.13%
  A. N. Franklin
15
0.05%
Nov 03, 1936 General Election
  Robert P. Hill
78,873
70.21%
  John W. Mee
33,071
29.44%
  S. A. Rourke
216
0.19%
  T. B. Williams
178
0.16%
Nov 06, 1934 General Election
  Josh Lee
58,322
74.64%
  Paul Huston
18,640
23.86%
  J. T. Bays
1,121
1.43%
  James W. Hill
52
0.07%
Nov 08, 1932 General Election
  Fletcher B. Swank(I)
64,303
64.25%
  Paul Huston
35,785
35.75%
Nov 04, 1930 General Election
  Fletcher B. Swank
38,225
58.66%
  Ulysses S. Stone(I)
26,943
41.34%
Nov 06, 1928 General Election
  Ulysses S. Stone
44,814
50.91%
  Fletcher B. Swank(I)
42,856
48.68%
  Philip Kusler
361
0.41%
Nov 02, 1926 General Election
  Fletcher B. Swank(I)
29,988
60.61%
  Barritt Galloway
19,491
39.39%
Nov 04, 1924 General Election
  Fletcher B. Swank(I)
44,683
59.43%
  John Golobie
28,510
37.92%
  John Franing
1,998
2.66%
Nov 07, 1922 General Election
  Fletcher B. Swank(I)
46,120
62.72%
  Ulysses S. Stone
26,893
36.57%
  Leonard Johnson
517
0.70%
Nov 02, 1920 General Election
  Fletcher B. Swank
35,167
50.68%
  Bayard T. Hainer
31,304
45.11%
  J. Luther Langston
2,922
4.21%
Nov 08, 1919 Special Election
  John William Harreld
11,782
51.30%
  Claude Weaver
11,074
48.22%
  Alonzo Turner
110
0.48%
Nov 05, 1918 General Election
  Joseph Bryan Thompson(I)
13,303
57.39%
  B. A. McAleer
9,180
39.60%
  J. Luther Langston
683
2.95%
  Alonzo Turner
13
0.06%
Nov 07, 1916 General Election
  Joseph Bryan Thompson(I)
17,828
49.47%
  George H. Dodson
12,716
35.28%
  Robert L. Allen
5,294
14.69%
  Amos Phifer
201
0.56%
Nov 03, 1914 General Election
  Joseph Bryan Thompson(I)
14,040
47.55%
  D. K. Pope
9,286
31.45%
  W. L. Lurry
5,391
18.26%
  Albert Rennie
669
2.27%
  J. E. Brewer
142
0.48%
Date Type Results
Nov 05, 1912 General Election
  Scott Ferris(I)
29,574
56.23%
  C. O. Clark
11,987
22.79%
  H. H. Stallard
11,033
20.98%
Nov 08, 1910 General Election
  Scott Ferris(I)
28,600
58.89%
  J. H. Franklin
13,425
27.64%
  H. H. Stallard
6,539
13.46%
Nov 03, 1908 General Election
  Scott Ferris(I)
31,026
55.75%
  Thompson
19,149
34.41%
  W. D. Davis
5,478
9.84%
Sep 17, 1907 General Election
  Scott Ferris
32,935
66.17%
  Henry D. McKnight
14,883
29.90%
  Wood Hubbard
1,956
3.93%

DISCUSSION
[Download as CSV]