|
|
"A comprehensive, collaborative elections resource."
|
Loughborough - History
 | Parliament DETAILS |
|
|
| Parents |
> United Kingdom > England > East Midlands > East Midlands > Loughborough
|
|
Raw Vote Total:

Percentages:
|
| Website | |
| Established | November 24, 1885 |
| Disbanded | Still Active |
| Last Modified | RBH August 24, 2021 06:33pm |
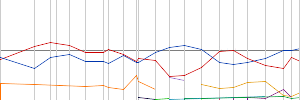
| Description | Boundary changes have given Loughborough the appearance of having a volatile political history. The bulk of the Leicestershire coalfield fell under Loughborough until 1983, and explained Labour control of the seat between 1945 and 1979. But then, in 1983, the coalfield was transferred into the Leicestershire North West constituency, and replaced by much of the Valley of the Soar. The Soar Valley, south of the town of Loughborough, contains many large suburban villages stretching right down to Leicester. Tory Stephen Dorrell took the seat in 1983 until 1997. In 1995, the Boundary Commission moved the bulk of the Soar Valley from Loughborough into the newly created Charnwood constituency. Mr Dorrell went on to contest Charnwood in 1997. So by 1997 Loughborough constituency had become fairly compact, and focused around the town of Loughborough itself, a small area of Wolds villages and the town of Shepshed, which it gained from Leicestershire North West. The new constituency is more evenly balanced now, although not immune from future volatility. The middle class areas of Nanpantan and Outwoods in the South West of Loughborough have Conservative tendencies, but otherwise Loughborough itself favours Labour. Loughborough is an industrial engineering town with many old terraces and council estates; some hosiery and knitwear industry remains in the area, for instance in Barrow-upon-Soar.
[Link] |
|
Redistricting: Light Green=Added Territory, Red=Removed Territory, Dark Green=Kept Territory
| |
| No Map In System
|
| Date |
Type |
Results |
| Dec 12, 2019 |
General Election |
|
| Jun 08, 2017 |
General Election |
|
| May 07, 2015 |
General Election |
|
| May 06, 2010 |
General Election |
|
| May 05, 2005 |
General Election |
|
| Jun 07, 2001 |
General Election |
|
| May 01, 1997 |
General Election |
|
| Apr 09, 1992 |
General Election |
|
| Jun 11, 1987 |
General Election |
|
| Jun 09, 1983 |
General Election |
|
| May 03, 1979 |
General Election |
|
| Oct 10, 1974 |
General Election |
|
| Feb 28, 1974 |
General Election |
|
| Jun 18, 1970 |
General Election |
|
| Mar 31, 1966 |
General Election |
|
| Oct 15, 1964 |
General Election |
|
| Oct 08, 1959 |
General Election |
|
| May 26, 1955 |
General Election |
|
| Oct 25, 1951 |
General Election |
|
| Feb 23, 1950 |
General Election |
|
| Jul 05, 1945 |
General Election |
|
| Nov 14, 1935 |
General Election |
|
|
|
[Download as CSV]
|
