Home About Chat Users Issues Party Candidates Polling Firms Media News Polls Calendar Key Races United States President Senate House Governors International

New User Account
"A comprehensive, collaborative elections resource." 
Email: Password:

  Edmonton-Strathcona - History
Provincial Legislature DETAILS
Parents > Canada > Alberta > AB Legislative Assembly > Edmonton-Strathcona
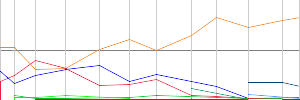
   Raw Vote Total:

Percentages:

Website
Established 00, 0000
Disbanded Still Active
Last ModifiedMonsieur November 20, 2004 05:11pm
DescriptionThis south-central Edmonton riding is bordered on the north mostly by the North Saskatchewan River, Connors Road and 90th Avenue, on the east by 75th and 103rd Streets, and on the south by Whitemud Drive. In the 2004 redistribution the riding lost a small eastern area to Edmonton-Mill Creek and gained a small southern area from Edmonton-Rutherford.

In Edmonton-Strathcona, education is the main employer, followed by health care and social services. The average household income is the third-lowest in Alberta at $46,394. In the riding, 16 per cent of residents are considered low income. Almost 20 per cent of the people here are immigrants. About 1.3 per cent are francophone.

RACES [Show Primaries]
Redistricting: Light Green=Added Territory, Red=Removed Territory,
Dark Green=Kept Territory
Date Type Results
Jun 23, 2025 By-election
  Naheed Nenshi
7,949
82.26%
  Darby-Rae Crouch
1,313
13.59%
  Don Slater
195
2.02%
  Samuel Petrov
116
1.20%
  Ravina Chand
66
0.68%
  Jesse Stretch
24
0.25%
May 29, 2023 General Election
  Rachel Notley(I)
13,980
79.73%
  Emad El-Zein
3,032
17.29%
  Robert Gooding-Townsend
324
1.85%
  Andrew Jacobson
106
0.60%
  Robert Nielsen
93
0.53%
Apr 16, 2019 General Election
  Rachel Notley(I)
14,724
72.10%
  Kulshan Gill
3,481
17.05%
  Prem Pal
1,139
5.58%
  Gary Horan
297
1.45%
  Samantha Hees
239
1.17%
  Stuart Andrews
227
1.11%
  Ian Smythe
86
0.42%
   Don Edward Meister
62
0.30%
  Naomi Rankin
61
0.30%
  Dale Doan
57
0.28%
  Gord McLean
49
0.24%
Date Type Results
May 05, 2015 General Election
  Rachel Notley(I)
13,592
82.42%
  Shelley Wenger
2,242
13.59%
  Steve Kochan
658
3.99%
Apr 23, 2012 General Election
  Rachel Notley(I)
3,457
64.32%
  Emerson Mayers
997
18.55%
  Meagen LaFave
619
11.52%
  Ed Ramsden
231
4.30%
  Terry Noel
71
1.32%
No Map In System
Date Type Results
Mar 03, 2008 General Election
  Rachel Notley
5,862
49.32%
  T.J. Keil
3,031
25.50%
  Tim Vant
2,452
20.63%
  Adrian Cole
540
4.54%
Nov 22, 2004 General Election
  Raj Pannu(I)
7,430
60.60%
  Shannon Stubbs
2,256
18.40%
  Steven Leard
1,850
15.09%
  Adrian Cole
287
2.34%
  Jeremy Burns
275
2.24%
  Kelly Graham
162
1.32%
Mar 12, 2001 General Election
  Raj Pannu(I)
6,998
50.61%
  John Logan
4,749
34.35%
  Jim Jacuta
1,944
14.06%
  James Lakinn
136
0.98%
Mar 11, 1997 General Election
  Raj Pannu
4,272
31.84%
  Mary MacDonald
4,214
31.41%
  John Logan
4,096
30.53%
  John Forget
552
4.11%
  Myles Kitagawa
236
1.76%
  Eshwar Jagdeo
47
0.35%
Jun 15, 1993 General Election
  Al Zariwny
6,542
39.40%
  Barrie Chivers(I)
5,121
30.85%
  Don Grimble
4,071
24.52%
  Patrick Ellis
460
2.77%
  Elizabeth Paschen
253
1.52%
  E. Benjamin Toane
108
0.65%
  Naomi Rankin
47
0.28%
Dec 17, 1990 By-election
  Barrie Chivers
4,927
52.76%
  Nadene Thomas
2,252
24.11%
  Eric Young
1,512
16.19%
  Elizabeth Paschen
424
4.54%
  Robert Alford
224
2.40%
Mar 20, 1989 General Election
  Gordon Wright(I)
6,696
52.08%
  Jack Scott
3,724
28.96%
  Philip Lister
2,437
18.95%

DISCUSSION
[Download as CSV]