Home About Chat Users Issues Party Candidates Polling Firms Media News Polls Calendar Key Races United States President Senate House Governors International

New User Account
"A comprehensive, collaborative elections resource." 
Email: Password:

  Calgary-North West - History
Provincial Legislature DETAILS
Parents > Canada > Alberta > AB Legislative Assembly > Calgary-North West   Raw Vote Total:

Percentages:

Website
Established 00, 0000
Disbanded Still Active
Last ModifiedMonsieur November 15, 2004 02:14pm
DescriptionThis northwest Calgary riding is bordered to the west by the city limits, on the north by Country Hills Boulevard, on the east by Sarcee Trail and on the south by the Bow River, Scurfield Drive and Crowchild Trail. In the 2004 redistribution this riding lost voters to Calgary-Foothills and Calgary-Bow.

Professional services and retail are the biggest employers in Calgary North West, where the average household earns $88,238 a year. Just under eight per cent of residents are considered low income. More than 23 per cent of people here are immigrants, while 45 per cent were born in Alberta. About 69 per cent of residents hold post-secondary degrees.

RACES [Show Primaries]
Redistricting: Light Green=Added Territory, Red=Removed Territory,
Dark Green=Kept Territory
Date Type Results
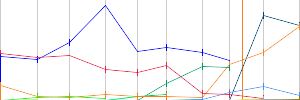
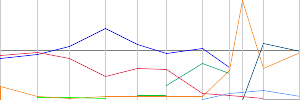
May 29, 2023 General Election
  Rajan Sawhney(I)
11,921
48.31%
  Michael Lisboa-Smith
11,778
47.73%
  Jennifer Yeremiy
778
3.15%
  Serena Thomsen
153
0.62%
  Alain Habel
45
0.18%
Apr 16, 2019 General Election
  Sonya Savage
13,565
56.67%
  Hafeez Chishti
7,611
31.80%
  Andrew Bradley
2,171
9.07%
  Cam Khan
262
1.09%
  Prerna Mahtani
258
1.08%
  Roberta McDonald
69
0.29%
Date Type Results
Nov 17, 2016 Party Switch
  Sandra Jansen(I)
1
100.00%
May 05, 2015 General Election
  Sandra Jansen(I)
6,320
32.72%
  Karen Mills
5,724
29.63%
  Jeff Callaway
5,163
26.73%
  Christopher Blatch
1,176
6.09%
  Neil Marion
935
4.84%
Apr 23, 2012 General Election
  Sandra Jansen
7,683
51.76%
  Chris Challis
5,454
36.74%
  Robert Prcic
992
6.68%
  Brian Malkinson
471
3.17%
  Bryan Hunt
140
0.94%
  Troy Millington
103
0.69%
No Map In System
Date Type Results
Mar 03, 2008 General Election
  Lindsay Blackett
8,415
46.21%
  Dale M. D'Silva
5,552
30.49%
  Chris Jukes
2,703
14.84%
  George Read
902
4.95%
  Collin Anderson
637
3.50%
Nov 22, 2004 General Election
  Greg Melchin(I)
7,768
55.36%
  Judy Stewart
4,488
31.98%
  Jeffery Krekoski
636
4.53%
  Jenell Friesen
622
4.43%
  Bob Brunet
518
3.69%
Mar 12, 2001 General Election
  Greg Melchin(I)
15,292
71.49%
  Paul Allard
4,971
23.24%
  Patricia Alward
828
3.87%
  Douglas A. Picken
299
1.40%
Mar 11, 1997 General Election
  Greg Melchin
9,190
53.24%
  Frank Bruseker(I)
7,226
41.86%
  Douglas A. Picken
503
2.91%
  Jeff Pattinson
342
1.98%
Jun 15, 1993 General Election
  Frank Bruseker(I)
6,763
47.68%
  Harley Torgerson
6,443
45.42%
  Paul Rasporich
495
3.49%
  David Grant
373
2.63%
  Paul Colver
110
0.78%
Mar 20, 1989 General Election
  Frank Bruseker
7,417
44.46%
  Stan Cassin(I)
6,985
41.87%
  Kelly Hegg
2,281
13.67%

DISCUSSION
[Download as CSV]