|
|
"A comprehensive, collaborative elections resource."
|
MD - District 02 - History
 | House of Representatives DETAILS |
|
|
| Parents |
> United States > Maryland > MD - District 02
|
|
Raw Vote Total:
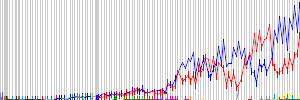
Percentages:

|
| Website | |
| Established | January 03, 1789 |
| Disbanded | Still Active |
| Last Modified | RP December 20, 2002 07:49pm |
| Description | |
|
Redistricting: Light Green=Added Territory, Red=Removed Territory, Dark Green=Kept Territory
| |
|
|
| Date |
Type |
Results |
| Nov 03, 2020 |
General Election |
|
| Jun 02, 2020 |
Primary Election |
|
| Jun 02, 2020 |
Primary Election |
|
| Nov 06, 2018 |
General Election |
|
| Jun 26, 2018 |
Primary Election |
|
| Jun 26, 2018 |
Primary Election |
|
| Nov 08, 2016 |
General Election |
|
| Apr 26, 2016 |
Primary Election |
|
| Apr 26, 2016 |
Primary Election |
|
| Nov 04, 2014 |
General Election |
|
| Jun 24, 2014 |
Primary Election |
|
| Nov 06, 2012 |
General Election |
|
| Apr 03, 2012 |
Primary Election |
|
| Apr 03, 2012 |
Primary Election |
|
|
|
|
| Date |
Type |
Results |
| Nov 02, 2010 |
General Election |
|
| Sep 14, 2010 |
Primary Election |
|
| Sep 14, 2010 |
Primary Election |
|
| Nov 04, 2008 |
General Election |
|
| Feb 12, 2008 |
Primary Election |
|
| Feb 12, 2008 |
Primary Election |
|
| Nov 07, 2006 |
General Election |
|
| Sep 12, 2006 |
Primary Election |
|
| Sep 12, 2006 |
Primary Election |
|
| Nov 02, 2004 |
General Election |
|
| Mar 02, 2004 |
Primary Election |
|
| Nov 05, 2002 |
General Election |
|
| Sep 10, 2002 |
Primary Election |
|
| Sep 10, 2002 |
Primary Election |
|
|
|
|
| Date |
Type |
Results |
| Nov 07, 2000 |
General Election |
|
| Mar 07, 2000 |
Primary Election |
|
| Nov 03, 1998 |
General Election |
|
| Sep 15, 1998 |
Primary Election |
|
| Sep 15, 1998 |
Primary Election |
|
| Nov 05, 1996 |
General Election |
|
| Mar 05, 1996 |
Primary Election |
|
| Mar 05, 1996 |
Primary Election |
|
| Nov 08, 1994 |
General Election |
|
| Sep 09, 1994 |
Primary Election |
|
| Sep 09, 1994 |
Primary Election |
|
| Nov 03, 1992 |
General Election |
|
| Mar 03, 1992 |
Primary Election |
|
| Mar 03, 1992 |
Primary Election |
|
|
|
|
| Date |
Type |
Results |
| Nov 06, 1990 |
General Election |
|
| Sep 11, 1990 |
Primary Election |
|
| Nov 08, 1988 |
General Election |
|
| Mar 08, 1988 |
Primary Election |
|
| Nov 04, 1986 |
General Election |
|
| Sep 09, 1986 |
Primary Election |
|
| Nov 06, 1984 |
General Election |
|
| May 08, 1984 |
Primary Election |
|
| May 08, 1984 |
Primary Election |
|
| Nov 02, 1982 |
General Election |
|
| Sep 14, 1982 |
Primary Election |
|
| Sep 14, 1982 |
Primary Election |
|
|
|
|
| Date |
Type |
Results |
| Nov 04, 1980 |
General Election |
|
| May 13, 1980 |
Primary Election |
|
| May 13, 1980 |
Primary Election |
|
| Nov 07, 1978 |
General Election |
|
| Sep 12, 1978 |
Primary Election |
|
| Sep 12, 1978 |
Primary Election |
|
| Nov 02, 1976 |
General Election |
|
| May 18, 1976 |
Primary Election |
|
| Nov 05, 1974 |
General Election |
|
| Nov 07, 1972 |
General Election |
|
| May 16, 1972 |
Primary Election |
|
| May 16, 1972 |
Primary Election |
|
|
|
| |
|
|
| Date |
Type |
Results |
| Nov 03, 1964 |
General Election |
|
| May 19, 1964 |
Primary Election |
|
| May 19, 1964 |
Primary Election |
|
| Nov 06, 1962 |
General Election |
|
| May 15, 1962 |
Primary Election |
|
| May 15, 1962 |
Primary Election |
|
| Nov 08, 1960 |
General Election |
|
| Nov 04, 1958 |
General Election |
|
| May 20, 1958 |
Primary Election |
|
| Nov 06, 1956 |
General Election |
|
| May 07, 1956 |
Primary Election |
|
| Nov 02, 1954 |
General Election |
|
| Jun 28, 1954 |
Primary Election |
|
| Nov 04, 1952 |
General Election |
|
| May 05, 1952 |
Primary Election |
|
| May 05, 1952 |
Primary Election |
|
|
|
| |
|
|
| Date |
Type |
Results |
| Nov 07, 1944 |
General Election |
|
| May 01, 1944 |
Primary Election |
|
| May 01, 1944 |
Primary Election |
|
| Nov 03, 1942 |
General Election |
|
| Sep 08, 1942 |
Primary Election |
|
| Sep 08, 1942 |
Primary Election |
|
| Nov 05, 1940 |
General Election |
|
| May 06, 1940 |
Primary Election |
|
| May 06, 1940 |
Primary Election |
|
| Nov 08, 1938 |
General Election |
|
| Sep 12, 1938 |
Primary Election |
|
| Nov 03, 1936 |
General Election |
|
| May 04, 1936 |
Primary Election |
|
| May 04, 1936 |
Primary Election |
|
| Nov 06, 1934 |
General Election |
|
| Sep 08, 1934 |
Primary Election |
|
| Sep 08, 1934 |
Primary Election |
|
| Nov 08, 1932 |
General Election |
|
| May 02, 1932 |
Primary Election |
|
| May 02, 1932 |
Primary Election |
|
| Nov 04, 1930 |
General Election |
|
| Sep 08, 1930 |
Primary Election |
|
| Nov 06, 1928 |
General Election |
|
| May 07, 1928 |
Primary Election |
|
| May 07, 1928 |
Primary Election |
|
| Nov 02, 1926 |
General Election |
|
| Nov 04, 1924 |
General Election |
|
| May 05, 1924 |
Primary Election |
|
|
|
|
| Date |
Type |
Results |
| Nov 07, 1922 |
General Election |
|
| Sep 11, 1922 |
Primary Election |
|
| Nov 02, 1920 |
General Election |
|
| Nov 05, 1918 |
Special Election |
|
| Nov 05, 1918 |
General Election |
|
| Nov 07, 1916 |
General Election |
|
| Nov 03, 1914 |
General Election |
|
| Nov 05, 1912 |
General Election |
|
| Nov 08, 1910 |
General Election |
|
| Nov 03, 1908 |
General Election |
|
| Nov 06, 1906 |
General Election |
|
| Nov 08, 1904 |
General Election |
|
| Nov 04, 1902 |
General Election |
|
|
|
| |
|
| |
|
| |
|
| |
|
| |
|
| |
|
| |
|
| |
|
| |
|
| |
|
|
| Date |
Type |
Results |
| Oct 03, 1831 |
General Election |
|
| Oct 05, 1829 |
General Election |
|
| Oct 02, 1826 |
General Election |
|
| Feb 01, 1826 |
Special Election |
|
| Oct 04, 1824 |
General Election |
|
| Oct 07, 1822 |
General Election |
|
| Oct 02, 1820 |
General Election |
|
| Oct 05, 1818 |
General Election |
|
| Oct 07, 1816 |
General Election |
|
| Oct 03, 1814 |
General Election |
|
| Oct 12, 1812 |
General Election |
|
| Oct 01, 1810 |
General Election |
|
| Oct 03, 1808 |
General Election |
|
| Oct 06, 1806 |
General Election |
|
| Oct 01, 1804 |
General Election |
|
| Oct 03, 1803 |
General Election |
|
|
|
| |
|
| |
|
| |
|
| |
|
[Download as CSV]
|
