|
|
"A collaborative political resource." |
Sudbury - History
 | Parliament DETAILS |
|
|
| Parents |
> Canada > Ontario > ON House of Commons
|
 |
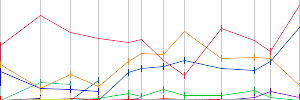
Raw Vote Total:

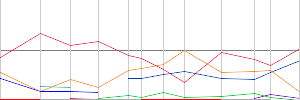
Percentages:

|
| Website | |
| Established | 00, 0000 |
| Disbanded | Still Active |
| Last Modified | Monsieur December 26, 2005 12:17pm |
| Description | This urban riding in northern Ontario consists of part of Greater Sudbury. The former city of Sudbury and the former town of Walden fall within the riding.
Mining and manufacturing are important to the economy, with companies such as Inco and Falconbridge Nickel based here. Average family income is $63,886 and the unemployment rate is 7.5 per cent, down from 9.3 per cent in the 2001 census.
According to the 2001 census, almost 21 per cent spoke French as their mother tongue. More than five per cent were Italian and two per cent are aboriginal.
Sudbury riding was established in 1947. In the 1996 redistribution, eight per cent of Nickel Belt was added. In 2004, more of Nickel Belt was added in the southwest. |
 | RACES |
|
|
| Date |
Type |
Results
[Show Primaries]
|
| Apr 28, 2025 |
General Election |
| | Viviane Lapointe(I)
31,328
51.79%
|
| Ian Symington
23,748
39.26%
|
| Nadia Verrelli
4,650
7.69%
|
| Nicholas Bonderoff
770
1.27%
|
| Craig Edwin Vogan
0
0.00%
|
|
| Sep 20, 2021 |
General Election |
| | Viviane Lapointe
15,871
34.52%
|
| Nadia Verrelli
13,569
29.52%
|
| Ian Symington
12,747
27.73%
|
| Colette Andréa Methé
2,735
5.95%
|
| David Robinson
940
2.04%
|
| J. David Popescu
111
0.24%
|
|
| Oct 21, 2019 |
General Election |
| | Paul Lefebvre(I)
19,643
40.94%
|
| Beth Mairs
13,885
28.94%
|
| Pierre St-Amant
9,864
20.56%
|
| Bill Crumplin
3,225
6.72%
|
| Sean Paterson
873
1.82%
|
| Chanel Lalonde
282
0.59%
|
| Charlene Sylvestre
135
0.28%
|
| | | J. David Popescu
70
0.15%
|
|
| Oct 19, 2015 |
General Election |
| | Paul Lefebvre
23,534
47.42%
|
| Paul Loewenberg
13,793
27.79%
|
| Fred Slade
10,473
21.10%
|
| David Robinson
1,509
3.04%
|
| Jean-Raymond Audet
134
0.27%
|
| Elizabeth Rowley
102
0.21%
|
| J. David Popescu
84
0.17%
|
|
| May 02, 2011 |
General Election |
| | Glenn Thibeault(I)
22,684
49.89%
|
| Fred Slade
12,916
28.41%
|
| Carol Hartman
8,172
17.97%
|
| Fred Twilley
1,349
2.97%
|
| Will Morin
228
0.50%
|
| J. David Popescu
116
0.26%
|
|
| Oct 14, 2008 |
General Election |
| | Glenn Thibeault
15,094
35.15%
|
| Diane Marleau(I)
12,969
30.20%
|
| Gerry Labelle
11,073
25.79%
|
| Gordon Harris
3,330
7.75%
|
| Will Morin
397
0.92%
|
| J. David Popescu
80
0.19%
|
|
| Jan 23, 2006 |
General Election |
| | Diane Marleau(I)
19,809
41.57%
|
| Gerry McIntaggart
15,225
31.95%
|
| Kevin Serviss
10,332
21.68%
|
| Joey Methé
1,301
2.73%
|
| Stephen Butcher
782
1.64%
|
| David Starbuck
77
0.16%
|
| Sam Hammond
70
0.15%
|
| | | J. David Popescu
54
0.11%
|
|
| Jun 28, 2004 |
General Election |
| | Diane Marleau(I)
18,914
44.19%
|
| Gerry McIntaggart
12,781
29.86%
|
| Stephen Butcher
9,008
21.05%
|
| Luke Norton
1,999
4.67%
|
| David Starbuck
100
0.23%
|
|
| Nov 27, 2000 |
General Election |
| | Diane Marleau(I)
20,290
58.52%
|
| Mike Smith
6,554
18.90%
|
| Paul Chislett
4,368
12.60%
|
| Alex McGregor
2,642
7.62%
|
| Thomas Gerry
503
1.45%
|
| Kathy Wells-McNeil
215
0.62%
|
| Daryl Janet Shandro
98
0.28%
|
|
| Jun 02, 1997 |
General Election |
| | Diane Marleau(I)
22,223
54.86%
|
| John Filo
8,471
20.91%
|
| Jim Rollo
5,198
12.83%
|
| Bill Lee
3,459
8.54%
|
| Kathy Wells-McNeil
502
1.24%
|
| Rejected Votes
412
1.02%
|
| Roy Hankonen
247
0.61%
|
|
| Oct 25, 1993 |
General Election |
| | Diane Marleau(I)
27,951
66.08%
|
| Mike Smith
5,788
13.68%
|
| Maurice Lamoureux
3,679
8.70%
|
| Rosemarie Blenkinsop
3,675
8.69%
|
| Paul Chislett
512
1.21%
|
| Billie Christiansen
276
0.65%
|
| David Shaw
202
0.48%
|
| | | Ed Pokonzie
129
0.30%
|
| Richard Gouin
86
0.20%
|
|
| Nov 21, 1988 |
General Election |
| | Diane Marleau
17,879
42.03%
|
| Bill Major
11,811
27.77%
|
| Bob Fera
9,356
21.99%
|
| Brent Ridley
3,391
7.97%
|
| Mike Phillips
102
0.24%
|
|
|

|

