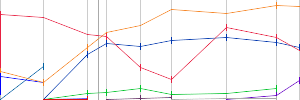
|
|
"A collaborative political resource." |
London—Fanshawe - History
 | Parliament DETAILS |
|
|
| Parents |
> Canada > Ontario > ON House of Commons
|
 |
Raw Vote Total:

Percentages:

|
| Website | |
| Established | June 02, 1997 |
| Disbanded | Still Active |
| Last Modified | Ralphie March 13, 2025 01:51pm |
| Description | This southwestern Ontario riding is made up of portions of the city of London. It stretches from the London city limits in the north to Exeter Road, Earnest Avenue and Bradley Avenue in the south between Highbury Avenue, the Thames River, CN Rail line, Wharncliffe Road and White Oak Road in the west and the London city limits in the east.
The riding takes in a broad mix of housing, workplaces and neighbourhoods. London Airport is in the riding. The major source of employment is manufacturing, followed by the service sector. Average family income is $58,351 and unemployment is seven per cent.
London-Fanshawe was created in 1996 from 71 per cent of London-Middlesex and 17 per cent of London East. The riding of London-Middlesex was created in 1976. The riding was not changed in the 2004 redistribution.
Population: 107,341 |
 | RACES |
|
|
| Date |
Type |
Results
[Show Primaries]
|
| Apr 28, 2025 |
General Election |
| | Kurt Holman
23,765
40.64%
|
| Najam Naqvi
17,820
30.48%
|
| Lindsay Mathyssen(I)
16,112
27.55%
|
| Daniel Buta
776
1.33%
|
| Walker Alain Drolet
0
0.00%
|
|
| Sep 20, 2021 |
General Election |
| | Lindsay Mathyssen(I)
22,336
43.44%
|
| Mattias Vanderley
12,486
24.28%
|
| Mohamed Hammoud
11,882
23.11%
|
| Kyle Free
4,718
9.18%
|
|
| Oct 21, 2019 |
General Election |
| | Lindsay Mathyssen
22,671
40.79%
|
| Mohamed Hammoud
14,924
26.85%
|
| Michael van Holst
13,770
24.78%
|
| Tom Cull
2,781
5.00%
|
| Bela Kosoian
1,132
2.04%
|
| Stephen R. Campbell
297
0.53%
|
|
| Oct 19, 2015 |
General Election |
| | Irene Mathyssen(I)
20,684
37.78%
|
| Khalil Ramal
17,214
31.44%
|
| Suzanna Dieleman
14,891
27.20%
|
| Matthew Peloza
1,604
2.93%
|
| Ali Hamadi
352
0.64%
|
|
| May 02, 2011 |
General Election |
| | Irene Mathyssen(I)
21,689
50.89%
|
| Jim Chahbar
14,300
33.55%
|
| Roger Caranci
4,893
11.48%
|
| Matthew Peloza
1,201
2.82%
|
| G.J. Rancourt
535
1.26%
|
|
| Oct 14, 2008 |
General Election |
| | Irene Mathyssen(I)
17,672
43.06%
|
| Mary Lou Ambrogio
12,659
30.85%
|
| Jacquie Gauthier
7,774
18.94%
|
| Dan O'Neail
2,656
6.47%
|
| Leonard VanderHoeven
276
0.67%
|
|
| Jan 23, 2006 |
General Election |
| | Irene Mathyssen
16,067
34.51%
|
| Glen Pearson
15,199
32.64%
|
| Dan Mailer
13,495
28.98%
|
| Dave McLaughlin
1,803
3.87%
|
|
| Jun 06, 2005 |
Party Switch |
|
| Jun 28, 2004 |
General Election |
| | Pat O'Brien(I)
15,664
38.08%
|
| Irene Mathyssen
12,511
30.41%
|
| John Mazzilli
10,811
26.28%
|
| Ed Moore
1,634
3.97%
|
| Derrall Bellaire
453
1.10%
|
| Cameron Switzer
65
0.16%
|
|
| Nov 27, 2000 |
General Election |
| | Pat O'Brien(I)
19,677
54.81%
|
| Robert Vaughan
7,998
22.28%
|
| Derrall Bellaire
4,119
11.47%
|
| Andrew Sadler
4,107
11.44%
|
|
| Jun 02, 1997 |
General Election |
| | Pat O'Brien(I)
20,497
50.82%
|
| Scott Bowman
6,838
16.96%
|
| Irene Mathyssen
6,754
16.75%
|
| Daniel Thrasher
5,499
13.64%
|
| Heidi Strasser
442
1.10%
|
| Rejected Votes
299
0.74%
|
|
|

|

