|
|
"A comprehensive, collaborative elections resource."
|
Toronto—Danforth - History
 | Provincial Parliament DETAILS |
|
|
| Parents |
> Canada > Ontario > ON Legislative Assembly > Toronto—Danforth
|
 |
Raw Vote Total:

Percentages:

|
| Website | |
| Established | October 02, 2003 |
| Disbanded | Still Active |
| Last Modified | Campari_007 October 21, 2020 12:48am |
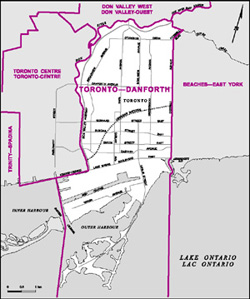
| Description | A predominantly blue-collar Toronto riding, almost 42 per cent of its residents are immigrants, according to the 2001 census. The most prominent are the Chinese community followed by the Greek community; the riding has the highest percentage of Greek speakers in the province.
The riding runs from the Toronto Harbour in the south to Don River/Millwood Road in the north, and from the Don Valley Parkway in the west to an eastern boundaries running along Coxwell Avenue, Greenwood Avenue and Leslie Street.
Industry is distributed between commercial and light industry, with many small businesses along the strip of Danforth Avenue known as Greektown.
The riding was created in the 1999 redistribution, taking in all of the former Riverdale riding, plus 40 per cent of the former York East riding and a few polls from Beaches-Woodbine.
Until June 2000, Toronto-Danforth was known as Broadview-Greenwood. The name was changed to reflect similar name changes in the local federal riding. |
|
Redistricting: Light Green=Added Territory, Red=Removed Territory, Dark Green=Kept Territory
| |
|
| |
| No Map In System
| |
|
[Download as CSV]
|