Home About Chat Users Issues Party Candidates Polling Firms Media News Polls Calendar Key Races United States President Senate House Governors International

New User Account
"A comprehensive, collaborative elections resource." 
Email: Password:

  ME - District 01 - History
House of Representatives DETAILS
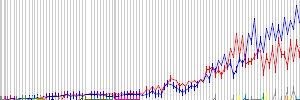
Parents > United States > Maine > ME - District 01   Raw Vote Total:

Percentages:

Website
Established March 04, 1823
Disbanded Still Active
Last ModifiedRP August 13, 2016 04:06pm
Description

RACES [Show Primaries]
Redistricting: Light Green=Added Territory, Red=Removed Territory,
Dark Green=Kept Territory
Date Type Results
Nov 05, 2024 General Election
  Democratic Primary Winner
0
0.00%
  Republican Primary Winner
0
0.00%
Nov 08, 2022 General Election
 Chellie Pingree(I)
219,753
62.93%
 Edwin Thelander
129,263
37.02%
  Write-In (W)
160
0.05%
Date Type Results
Nov 03, 2020 General Election
 Chellie Pingree(I)
271,004
62.15%
 Jay T. Allen
165,008
37.84%
  Write-In (W)
15
0.00%
 Ian Arthur Leavitt (W)
0
0.00%
 Nancy Farrand (W)
0
0.00%
Nov 06, 2018 General Election
 Chellie Pingree(I)
201,195
58.82%
 Mark Holbrook
111,188
32.51%
 Martin Grohman
29,670
8.67%
Nov 08, 2016 General Election
 Chellie Pingree(I)
227,546
57.99%
 Mark Holbrook
164,569
41.94%
 James L. Bouchard (W)
276
0.07%
Nov 04, 2014 General Election
 Chellie Pingree(I)
186,674
60.43%
 Isaac James Misiuk
94,751
30.67%
 Richard Murphy
27,410
8.87%
 Barry D. Stephens (W)
63
0.02%
Nov 06, 2012 General Election
 Chellie Pingree(I)
236,363
64.79%
 Jonathan T. E. Courtney
128,440
35.21%
Date Type Results
Nov 02, 2010 General Election
 Chellie Pingree(I)
169,114
56.82%
 Dean Scontras
128,501
43.17%
  Others (W)
42
0.01%
 Walter Horton (W)
0
0.00%
 Alan Lowberg (W)
0
0.00%
Nov 04, 2008 General Election
 Chellie Pingree
205,629
54.90%
 Charles E. "Charlie" Summers
168,930
45.10%
Nov 07, 2006 General Election
 Tom Allen(I)
170,949
60.84%
 Darlene J. Curley
88,009
31.32%
 Dexter Kamilewicz
22,029
7.84%
Nov 02, 2004 General Election
 Tom Allen(I)
219,077
59.74%
 Charles E. "Charlie" Summers
147,663
40.26%
Date Type Results
Nov 05, 2002 General Election
 Tom Allen(I)
172,646
63.81%
 Steven Joyce
97,931
36.19%
Nov 07, 2000 General Election
 Tom Allen(I)
202,823
59.81%
 Jane A. Amero
123,915
36.54%
 J. Frederic Staples
12,356
3.64%
Nov 03, 1998 General Election
 Tom Allen(I)
134,335
60.33%
 Ross J. Connelly
79,160
35.55%
 Eric R. Greiner
9,182
4.12%
Nov 05, 1996 General Election
 Tom Allen
173,745
55.30%
 James B. Longley, Jr.(I)
140,354
44.68%
  Others (W)
65
0.02%
Nov 08, 1994 General Election
 James B. Longley, Jr.
136,316
51.88%
 Dennis L. "Duke" Dutremble
126,373
48.09%
  Others
80
0.03%
Date Type Results
Nov 03, 1992 General Election
 Thomas H. Andrews(I)
232,696
64.97%
 Linda Bean
125,236
34.97%
  Others (W)
216
0.06%
Nov 06, 1990 General Election
 Thomas H. Andrews
167,623
60.11%
 David F. Emery
110,836
39.74%
  Others (W)
413
0.15%
Nov 08, 1988 General Election
 Joseph E. Brennan(I)
190,989
63.21%
 Edward S. O'Meara
111,125
36.78%
  Write-In (W)
49
0.02%
Nov 04, 1986 General Election
 Joseph E. Brennan
121,848
53.15%
 H. Rollin Ives
100,260
43.74%
 Plato Truman
7,109
3.10%
  Write-In (W)
16
0.01%
Nov 06, 1984 General Election
 John McKernan(I)
182,785
63.52%
 Barry J. Hobbins
104,972
36.48%
Date Type Results
Nov 02, 1982 General Election
 John McKernan
124,850
50.35%
 John M. Kerry
118,884
47.95%
 Gregory J. Flemming
4,221
1.70%
Nov 04, 1980 General Election
 David F. Emery(I)
188,667
68.49%
 Harold C. Pachios
86,819
31.51%
Nov 07, 1978 General Election
 David F. Emery(I)
120,791
61.48%
 John Quinn
70,348
35.80%
 J. David Madigan
5,346
2.72%
Date Type Results
Nov 02, 1976 General Election
 David F. Emery(I)
145,523
57.38%
 Frederick B. Barton
108,105
42.62%
Nov 05, 1974 General Election
 David F. Emery
94,203
50.18%
 Peter N. Kyros(I)
93,524
49.82%
Nov 07, 1972 General Election
 Peter N. Kyros(I)
129,408
59.36%
 L. Robert Porteous, Jr.
88,588
40.64%
Nov 03, 1970 General Election
 Peter N. Kyros(I)
99,483
59.16%
 Ronald T. Speers
68,671
40.84%
Nov 05, 1968 General Election
 Peter N. Kyros(I)
113,501
56.62%
 Horace A. Hildreth
86,949
43.38%
Nov 08, 1966 General Election
 Peter N. Kyros
81,302
50.38%
 Peter A. Garland
72,984
45.22%
 Thomas L. Maynard
7,098
4.40%
Nov 03, 1964 General Election
 Stanley R. Tupper(I)
95,398
50.05%
 Kenneth M. Curtis
95,195
49.95%
Nov 06, 1962 General Election
 Stanley R. Tupper(I)
85,864
59.63%
 Ronald Kellam
58,129
40.37%
Date Type Results
Nov 08, 1960 General Election
 Peter A. Garland
85,821
53.76%
 James C. Oliver(I)
73,826
46.24%
Sep 08, 1958 General Election
 James C. Oliver
55,686
52.08%
 Robert Hale(I)
51,231
47.92%
Sep 10, 1956 General Election
 Robert Hale(I)
58,028
50.01%
 James C. Oliver
57,999
49.99%
Sep 13, 1954 General Election
 Robert Hale(I)
47,327
52.07%
 James C. Oliver
43,561
47.93%
Sep 08, 1952 General Election
 Robert Hale(I)
56,239
61.59%
 James A. McVicar
35,078
38.41%
Sep 11, 1950 General Election
 Robert Hale(I)
48,869
54.01%
 Lucia M. Cormier
41,620
45.99%
Sep 13, 1948 General Election
 Robert Hale(I)
52,536
62.50%
 James A. McVicar
31,528
37.50%
Sep 05, 1946 General Election
 Robert Hale(I)
38,975
59.64%
 John C. Fitzgerald
26,378
40.36%
Sep 11, 1944 General Election
 Robert Hale(I)
47,721
68.82%
 Andrew A. Pettis
21,620
31.18%
Sep 14, 1942 General Election
 Robert Hale
38,128
57.00%
 Louis J. Brann
28,759
43.00%
Sep 09, 1940 General Election
 James C. Oliver(I)
55,503
63.42%
 Peter M. MacDonald
32,018
36.58%
Sep 12, 1938 General Election
 James C. Oliver(I)
57,642
58.97%
 Harold B. Emery
40,103
41.03%
Sep 14, 1936 General Election
 James C. Oliver
60,565
57.86%
 Simon M. Hamlin(I)
44,106
42.14%
Sep 10, 1934 General Election
 Simon M. Hamlin
48,235
50.84%
 Carroll L. Beedy(I)
46,635
49.16%
Sep 12, 1932 General Election
 Carroll L. Beedy(I)
41,112
51.09%
 Joseph E. F. Connolly
39,356
48.91%
Date Type Results
Sep 08, 1930 General Election
 Carroll L. Beedy(I)
23,434
61.39%
 Thomas F. Locke
14,741
38.61%
Sep 10, 1928 General Election
 Carroll L. Beedy(I)
40,255
67.69%
 Elvington P. Spinney
19,219
32.31%
Sep 13, 1926 General Election
 Carroll L. Beedy(I)
27,040
62.78%
 Richard E. Hersom
16,032
37.22%
Sep 08, 1924 General Election
 Carroll L. Beedy(I)
39,269
59.21%
 William M. Ingraham
27,058
40.79%
Sep 11, 1922 General Election
 Carroll L. Beedy(I)
26,050
58.72%
 Louis A. Donahue
18,312
41.28%
Sep 13, 1920 General Election
 Carroll L. Beedy
30,810
66.59%
 Frank H. Haskell
15,456
33.41%
Sep 09, 1918 General Election
 Louis B. Goodall(I)
15,565
53.76%
 Lamont A. Stevens
13,388
46.24%
Sep 11, 1916 General Election
 Louis B. Goodall
20,357
54.20%
 Lamont A. Stevens
16,807
44.75%
 Orville F. Bingham
310
0.83%
 James Perrigo
86
0.23%
Sep 14, 1914 General Election
 Asher C. Hinds(I)
16,622
47.03%
 John C. Seates
16,035
45.37%
 Walter C. Emerson
2,276
6.44%
 Henry W. Pinkham
407
1.15%
Sep 09, 1912 General Election
 Asher C. Hinds(I)
17,635
51.72%
 Michael T. O'Brien
15,580
45.69%
 Israel Albert
463
1.36%
 James Perrigo
420
1.23%
Date Type Results
Sep 12, 1910 General Election
 Asher C. Hinds
17,521
49.79%
 William M. Pennell
16,901
48.03%
 James Perrigo
433
1.23%
 Percy F. Morse
332
0.94%
Sep 14, 1908 General Election
 Amos L. Allen(I)
18,887
53.49%
 John C. Seates
15,615
44.23%
 Alphonso N. Witham
433
1.23%
 Joseph Lafontaine
373
1.06%
Sep 10, 1906 General Election
 Amos L. Allen(I)
16,903
51.89%
 James C. Hamlen
15,254
46.83%
 Nelson H. Lord
416
1.28%
Sep 12, 1904 General Election
 Amos L. Allen(I)
18,301
57.21%
 Luther R. Moore
13,320
41.64%
 Percy F. Morse
368
1.15%
Sep 08, 1902 General Election
 Amos L. Allen(I)
16,232
58.23%
 Seth C. Gordon
11,097
39.81%
 Fred Irish
548
1.97%
Sep 10, 1900 General Election
 Amos L. Allen(I)
17,803
60.33%
 John J. Lynch
10,040
34.02%
 Daniel P. Parker
1,533
5.19%
 Clifford Simonton
135
0.46%
Nov 07, 1899 Special Election
 Amos L. Allen
12,339
61.56%
 Luther F. McKinney
7,704
38.44%
Sep 12, 1898 General Election
 Thomas B. Reed(I)
14,598
59.84%
 Luther F. McKinney
9,072
37.19%
 Daniel P. Parker
673
2.76%
 Wescot E. Moulton
53
0.22%
Sep 14, 1896 General Election
 Thomas B. Reed(I)
19,329
66.90%
 Edward W. Staples
8,790
30.42%
 Aaron Clark
604
2.09%
 James E. Campion
169
0.58%
Sep 10, 1894 General Election
 Thomas B. Reed(I)
17,086
63.53%
 John W. Deering
8,901
33.10%
 Linus Seely
592
2.20%
 James E. Campion
315
1.17%
Sep 12, 1892 General Election
 Thomas B. Reed(I)
16,312
51.56%
 Darius Horgraham
14,635
46.26%
 Willis P. Tucker
691
2.18%
Sep 08, 1890 General Election
 Thomas B. Reed(I)
16,797
57.18%
 Melvin P. Frank
11,971
40.75%
 Timothy B. Hussey
557
1.90%
 Gardiner D. Weeks
51
0.17%
Sep 10, 1888 General Election
 Thomas B. Reed(I)
18,288
52.30%
 William Emery
15,849
45.33%
 Timothy B. Hussey
829
2.37%
Sep 13, 1886 General Election
 Thomas B. Reed(I)
15,625
50.32%
 William H. Clifford
14,298
46.05%
 Timothy B. Hussey
756
2.43%
 David O. Moulton
371
1.19%
Sep 08, 1884 General Election
 Thomas B. Reed(I)
17,594
51.03%
 Nathan Cleeves
16,669
48.35%
 Aaron Clark
190
0.55%
 Samuel Jewett
23
0.07%
Date Type Results
Sep 13, 1880 General Election
 Thomas B. Reed(I)
16,920
49.80%
 Samuel J. Anderson
16,803
49.45%
 James P. Stone
256
0.75%
Sep 09, 1878 General Election
 Thomas B. Reed(I)
13,483
46.23%
 Samuel J. Anderson
9,333
32.00%
 Edward H. Gove
6,348
21.77%
Sep 11, 1876 General Election
 Thomas B. Reed
16,248
51.45%
 John M. Goodwin
15,156
47.99%
 John H. Burleigh(I)
177
0.56%
Sep 14, 1874 General Election
 John H. Burleigh(I)
12,275
53.18%
 Bion Bradbury
10,805
46.82%
Sep 09, 1872 General Election
 John H. Burleigh
15,485
53.95%
 William H. Clifford
13,216
46.05%
Sep 12, 1870 General Election
 John Lynch(I)
12,571
53.16%
 William P. Haines
11,075
46.84%
Sep 14, 1868 General Election
 John Lynch(I)
16,818
53.57%
 Charles A. Shaw
14,579
46.43%
Sep 10, 1866 General Election
 John Lynch
15,611
57.05%
 Lorenzo D. Sweat
11,753
42.95%
Sep 11, 1864 General Election
 John Lynch
15,096
54.57%
 Lorenzo D. Sweat(I)
12,568
45.43%
Sep 08, 1862 General Election
 Lorenzo D. Sweat
10,332
48.73%
 John Noble Goodwin(I)
10,205
48.13%
  Scattering
665
3.14%
Date Type Results
Sep 10, 1860 General Election
 John Noble Goodwin
12,018
53.00%
 Thomas M. Hayes
10,556
46.55%
 Nathan Webb
101
0.45%
Sep 13, 1858 General Election
 Daniel E. Somes
10,410
50.57%
 Ira T. Drew
9,955
48.36%
 Manassah H. Smith
219
1.06%
Sep 09, 1856 General Election
 John M. Wood(I)
11,215
53.43%
 Josiah S. Little
9,776
46.57%
Sep 11, 1854 General Election
 John M. Wood
9,211
59.36%
 Samuel Wells
6,192
39.90%
 Lorenzo D. Wilkinson
114
0.73%
Sep 13, 1852 General Election
 Moses MacDonald(I)
9,218
57.94%
 Nathan D. Appleton
5,333
33.52%
 Samuel Fessenden
1,358
8.54%
Date Type Results
Sep 09, 1850 General Election
 Moses MacDonald
5,173
49.81%
 Nathan D. Appleton
4,683
45.09%
 M. Sweat
530
5.10%
Sep 11, 1848 General Election
 Elbridge Gerry
5,897
55.00%
 John Jameson
3,984
37.16%
 David Gerry
840
7.84%
Sep 14, 1846 General Election
 David Hammonds
5,430
54.02%
 Samuel Hopkins
3,521
35.03%
 Theodore Stevens
1,101
10.95%
Sep 08, 1845 General Election
 John F. Scammon
5,177
57.05%
 Samuel Hopkins
3,187
35.12%
 Theodore Stevens
526
5.80%
 Joshua Herrick(I) (W)
185
2.04%
Date Type Results
Sep 11, 1843 General Election
 Joshua Herrick
4,510
51.53%
 Jonathan Tucker
1,142
13.05%
 Burleigh Smart
1,114
12.73%
 Nathan Clifford(I)
980
11.20%
 William Lord
443
5.06%
 Samuel A. Bradley
395
4.51%
 William A. Hayes
108
1.23%
  Unidentified Scattering
60
0.69%
Date Type Results
Sep 14, 1840 General Election
 Nathan Clifford(I)
5,428
54.59%
 Daniel Goodenow
4,516
45.41%
Sep 10, 1838 General Election
 Nathan Clifford
5,568
54.98%
 Nathan D. Appleton
4,560
45.02%
Dec 12, 1836 General Election
 John Fairfield(I)
3,991
61.90%
 Horace Porter
2,457
38.10%
Dec 08, 1834 General Election
 John Fairfield
2,081
57.52%
 Horace Porter
1,537
42.48%
Sep 09, 1833 General Election
 Rufus McIntire(I)
3,662
64.07%
 Moses Emery
2,054
35.93%
Date Type Results
Sep 13, 1830 General Election
 Rufus McIntire(I)
3,592
52.00%
 George Scamman
3,248
47.02%
 Unidentified Scattering
68
0.98%
Sep 08, 1828 General Election
 Rufus McIntire(I)
2,981
66.02%
 Simon Nowall
337
7.46%
 Nathaniel Appleton
319
7.07%
 Samuel A. Bradley
260
5.76%
 Moses Emery
222
4.92%
 Unidentified Scattering
202
4.47%
 John Holmes
194
4.30%
Sep 27, 1827 Special Election
 Rufus McIntire
2,174
52.95%
 John Holmes
1,932
47.05%
Sep 11, 1826 General Election
 William Burleigh(I)
2,140
60.45%
 Rufus McIntire
1,350
38.14%
 Unidentified Scattering (W)
50
1.41%
Sep 13, 1824 General Election
 William Burleigh(I)
2,840
67.62%
 Rufus McIntire
924
22.00%
 John McDonald
346
8.24%
 Isaac Lane
35
0.83%
 Jeremiah Goodwin
34
0.81%
 Unidentified Scattering
21
0.50%
Nov 03, 1823 General Election
 William Burleigh
2,090
51.08%
 Rufus McIntire
1,904
46.53%
 Isaac Lane
72
1.76%
 Unidentified Scattering
26
0.64%

DISCUSSION
[Download as CSV]