Home About Chat Users Issues Party Candidates Polling Firms Media News Polls Calendar Key Races United States President Senate House Governors International

New User Account
"A comprehensive, collaborative elections resource." 
Email: Password:

  KS - District 01 - History
House of Representatives DETAILS
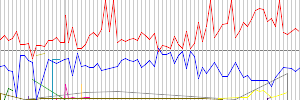
Parents > United States > Kansas > KS - District 01   Raw Vote Total:

Percentages:

Website
Established March 04, 1875
Disbanded Still Active
Last ModifiedChronicler May 05, 2008 08:11pm
DescriptionRemaining to be verified: 1882-1942

RACES [Don't Show Primaries]
Redistricting: Light Green=Added Territory, Red=Removed Territory,
Dark Green=Kept Territory
Date Type Results
Nov 05, 2024 General Election
  Democratic Primary Winner
0
0.00%
  Republican Primary Winner
0
0.00%
Aug 06, 2024 Primary Election
 Tracey Mann(I)
0
0.00%
Nov 08, 2022 General Election
 Tracey Mann(I)
161,333
67.67%
 James "Jimmy" Beard
77,092
32.33%
Date Type Results
Nov 03, 2020 General Election
 Tracey Mann
208,229
71.16%
 Kali Barnett
84,393
28.84%
Aug 04, 2020 Primary Election
 Kali Barnett
16,671
62.60%
 Christy Cauble Davis
9,962
37.40%
Aug 04, 2020 Primary Election
 Tracey Mann
65,373
54.21%
 Bill Clifford
39,914
33.10%
 Jerry Molstad
9,545
7.92%
 Michael Soetaert
5,756
4.77%
Nov 06, 2018 General Election
 Roger Marshall(I)
153,082
68.15%
 Alan LaPolice
71,558
31.85%
Aug 07, 2018 Primary Election
 Roger Marshall(I)
64,843
78.66%
 Nicholas Lee Reinecker
17,593
21.34%
Aug 07, 2018 Primary Election
 Alan LaPolice
17,195
100.00%
Nov 08, 2016 General Election
 Roger Marshall
169,992
65.90%
 Alan LaPolice
67,739
26.26%
 Kerry Burt
19,366
7.51%
 Tim Huelskamp(I) (W)
874
0.34%
Aug 02, 2016 Primary Election
 Roger Marshall
59,889
56.56%
 Tim Huelskamp(I)
45,997
43.44%
Nov 04, 2014 General Election
 Tim Huelskamp(I)
138,674
67.95%
 James E. "Jim" Sherow
65,397
32.05%
Aug 05, 2014 Primary Election
 James E. "Jim" Sherow
8,079
65.72%
 Bryan R. Whitney
4,214
34.28%
Aug 05, 2014 Primary Election
 Tim Huelskamp(I)
42,847
54.96%
 Alan LaPolice
35,108
45.04%
Nov 06, 2012 General Election
 Tim Huelskamp(I)
211,337
100.00%
Date Type Results
Nov 02, 2010 General Election
 Tim Huelskamp
142,281
73.76%
 Alan Jilka
44,068
22.85%
 Jack W. Warner
6,537
3.39%
Aug 03, 2010 Primary Election
 Tim Huelskamp
34,819
34.82%
 James A. "Jim" Barnett
25,047
25.05%
 Tracey Mann
21,161
21.16%
 Rob Wasinger
9,296
9.30%
 Sue Boldra
7,892
7.89%
 Marck Redell Cobb
1,768
1.77%
Aug 03, 2010 Primary Election
 Alan Jilka
15,399
100.00%
Nov 04, 2008 General Election
 Jerry Moran(I)
214,549
81.88%
 James Bordonaro
34,771
13.27%
 Kathleen Burton
7,145
2.73%
 Jack W. Warner
5,562
2.12%
Nov 07, 2006 General Election
 Jerry Moran(I)
153,298
78.65%
 John Doll
38,820
19.92%
 Sylvester Cain
2,792
1.43%
Nov 02, 2004 General Election
 Jerry Moran(I)
239,776
90.72%
 Jack W. Warner
24,517
9.28%
Nov 05, 2002 General Election
 Jerry Moran(I)
186,850
91.10%
 Jack W. Warner
18,250
8.90%
Date Type Results
Nov 07, 2000 General Election
 Jerry Moran(I)
216,484
89.34%
 Jack W. Warner
25,843
10.66%
Nov 03, 1998 General Election
 Jerry Moran(I)
152,775
80.67%
 Jim Phillips
36,618
19.33%
Nov 05, 1996 General Election
 Jerry Moran
191,899
73.48%
 John Divine
63,948
24.49%
 Bill Earnest
5,298
2.03%
Aug 06, 1996 Primary Election
 Jerry Moran
79,119
75.80%
 R. W. Yeager
15,376
14.73%
 Bert Fisher
9,887
9.47%
Nov 08, 1994 General Election
 Pat Roberts(I)
169,531
77.41%
 Terry L. Nichols
49,477
22.59%
Nov 03, 1992 General Election
 Pat Roberts(I)
194,912
68.32%
 Duane West
83,620
29.31%
 Steven Rosile
6,765
2.37%
Aug 04, 1992 Primary Election
 Duane West
18,064
42.83%
 John Divine
16,431
38.96%
 Jerry Molstad
7,678
18.21%
Date Type Results
Nov 06, 1990 General Election
 Pat Roberts(I)
102,974
62.64%
 Duane West
61,396
37.35%
  Others (W)
18
0.01%
Nov 08, 1988 General Election
 Pat Roberts(I)
168,700
100.00%
Nov 04, 1986 General Election
 Pat Roberts(I)
141,297
76.52%
 Dale Lyon
43,359
23.48%
Nov 06, 1984 General Election
 Pat Roberts(I)
159,931
75.88%
 Darrell Ringer
49,015
23.26%
 Clement Scoggin
1,816
0.86%
Nov 02, 1982 General Election
 Pat Roberts(I)
115,749
68.44%
 Kent Roth
51,079
30.20%
 Kent Earnest
2,305
1.36%
Aug 03, 1982 Primary Election
 Pat Roberts(I)
46,929
85.95%
 Charles Sellens
7,669
14.05%
Date Type Results
Nov 04, 1980 General Election
 Pat Roberts
121,545
62.29%
 Phil Martin
73,586
37.71%
Aug 05, 1980 Primary Election
 Pat Roberts
37,389
55.58%
 Steve Pratt
24,231
36.02%
 Donald R. Nicholson
5,649
8.40%
Aug 05, 1980 Primary Election
 Phil Martin
17,912
57.62%
 Jeff Harsh
13,175
42.38%
Nov 07, 1978 General Election
 Keith G. Sebelius(I)
131,037
100.00%
Nov 02, 1976 General Election
 Keith G. Sebelius(I)
142,311
73.07%
 Randy C. Yowell
52,459
26.93%
Aug 03, 1976 Primary Election
 Randy C. Yowell
16,342
62.57%
 W.H. "Bill" Addington
9,777
37.43%
Nov 05, 1974 General Election
 Keith G. Sebelius(I)
101,565
58.42%
 Donald C. "Don" Smith
57,326
32.97%
 Thelma Morgan
13,009
7.48%
 Lorin P. Miller
1,968
1.13%
Aug 06, 1974 Primary Election
 Donald C. "Don" Smith
14,149
48.33%
 Chuck Wilson
8,853
30.24%
 Homer Kruckenberg
6,274
21.43%
Nov 07, 1972 General Election
 Keith G. Sebelius(I)
145,712
77.24%
 Morris Coover
40,678
21.56%
 Daniel Scoggin
2,267
1.20%
Date Type Results
Nov 03, 1970 General Election
 Keith G. Sebelius(I)
84,163
56.98%
 Billy D. Jellison
63,551
43.02%
Nov 05, 1968 General Election
 Keith G. Sebelius
87,012
51.45%
 George W. Meeker
82,102
48.55%
Aug 06, 1968 Primary Election
 Keith G. Sebelius
29,400
48.32%
 Gerald Shadwick
24,304
39.95%
 W. H. Crotinger
7,139
11.73%
Nov 08, 1966 General Election
 Robert J. "Bob" Dole(I)
97,487
68.63%
 Berniece Henkle
44,569
31.37%
Date Type Results
Nov 03, 1964 General Election
 Robert J. "Bob" Dole(I)
113,212
51.16%
 Bill Bork
108,086
48.84%
Nov 06, 1962 General Election
 Robert J. "Bob" Dole(I)
102,499
55.83%
 J. Floyd Breeding(I)
81,092
44.17%
Date Type Results
Nov 08, 1960 General Election
 William H. Avery(I)
84,816
63.10%
 Marshall G. Gardiner
49,598
36.90%
Aug 02, 1960 Primary Election
 William H. Avery(I)
34,975
70.24%
 Robert R. Turney
14,819
29.76%
Nov 04, 1958 General Election
 William H. Avery(I)
60,198
51.22%
 Robert W. Domme
55,749
47.44%
 Marie I. Hadin
1,575
1.34%
Aug 05, 1958 Primary Election
 Robert W. Domme
11,323
68.03%
 Loren Breeding
5,322
31.97%
Nov 06, 1956 General Election
 William H. Avery(I)
69,841
53.08%
 Howard S. Miller
60,313
45.84%
 Howard Hadin
1,417
1.08%
Aug 07, 1956 Primary Election
 Howard S. Miller
9,841
59.03%
 Allen Engler
6,829
40.97%
Nov 02, 1954 General Election
 William H. Avery
56,079
54.32%
 Howard S. Miller(I)
47,165
45.68%
Aug 03, 1954 Primary Election
 William H. Avery
22,077
40.52%
 Doral H. Hawks
19,952
36.62%
 Elmer Curtis
8,738
16.04%
 David Karnowski
2,028
3.72%
 Francis Holton
1,685
3.09%
Nov 04, 1952 General Election
 Howard S. Miller
68,909
51.47%
 Albert M. Cole(I)
64,963
48.53%
Nov 07, 1950 General Election
 Albert M. Cole(I)
66,607
66.49%
 Ewell Stewart
33,562
33.51%
Aug 01, 1950 Primary Election
 Ewell Stewart
5,337
53.93%
 Charles Riseley
4,560
46.07%
Aug 01, 1950 Primary Election
 Albert M. Cole(I)
33,810
61.29%
 Walter G. Stumbo
21,356
38.71%
Nov 02, 1948 General Election
 Albert M. Cole(I)
68,395
60.47%
 James L. Quinn
44,711
39.53%
Nov 05, 1946 General Election
 Albert M. Cole(I)
63,076
64.28%
 James W. Lowry
35,045
35.72%
Aug 06, 1946 Primary Election
 Albert M. Cole(I)
24,659
60.20%
 William P. Lambertson
16,303
39.80%
Nov 07, 1944 General Election
 Albert M. Cole
71,565
67.33%
 Ralph Ulm
34,731
32.67%
Aug 01, 1944 Primary Election
 Albert M. Cole
20,789
53.23%
 William P. Lambertson(I)
18,265
46.77%
Nov 03, 1942 General Election
 William P. Lambertson(I)
49,962
59.22%
 John E. Barrett
34,404
40.78%
Date Type Results
Nov 05, 1940 General Election
 William P. Lambertson(I)
64,766
61.02%
 Clive R. Lane
41,375
38.98%
Nov 08, 1938 General Election
 William P. Lambertson(I)
65,945
60.32%
 H.N. Hensley
43,374
39.68%
Nov 03, 1936 General Election
 William P. Lambertson(I)
66,158
58.31%
 Howard S. Miller
47,303
41.69%
Nov 06, 1934 General Election
 William P. Lambertson(I)
66,293
60.54%
 John H. Arnett
43,205
39.46%
Nov 08, 1932 General Election
 William P. Lambertson(I)
59,241
57.79%
 M.R. Howard
34,244
33.41%
 George C. Hall
9,019
8.80%
Aug 02, 1932 Primary Election
 William P. Lambertson(I)
34,794
56.99%
 James G. Strong(I)
26,256
43.01%
Aug 02, 1932 Primary Election
 M.R. Howard
7,800
53.20%
 George G. Bunger
6,863
46.80%
Date Type Results
Nov 04, 1930 General Election
 William P. Lambertson(I)
53,799
100.00%
Nov 06, 1928 General Election
 William P. Lambertson
48,543
68.34%
 Maurice P. O'Keefe
22,492
31.66%
Aug 07, 1928 Primary Election
 William P. Lambertson
15,738
30.20%
 James M. Challiss
10,032
19.25%
 S. M. Brewster
8,977
17.23%
 Ewing Herbert
8,140
15.62%
 James C. Davis
4,553
8.74%
 Ernest N. Underwood
2,352
4.51%
 C. C. Lull
1,200
2.30%
  Jacob J. Banks
1,124
2.16%
Nov 02, 1926 General Election
 Daniel R. Anthony, Jr.(I)
46,232
100.00%
Aug 03, 1926 Primary Election
 Daniel R. Anthony, Jr.(I)
22,937
52.26%
 William P. Lambertson
18,161
41.38%
 E. W. Crancer
2,791
6.36%
Nov 04, 1924 General Election
 Daniel R. Anthony, Jr.(I)
49,676
70.81%
 Lee Eppinger
20,474
29.19%
Aug 05, 1924 Primary Election
 Daniel R. Anthony, Jr.(I)
21,858
51.98%
 William P. Lambertson
20,194
48.02%
Nov 07, 1922 General Election
 Daniel R. Anthony, Jr.(I)
39,463
63.71%
 Frank Gragg
22,480
36.29%
Aug 01, 1922 Primary Election
 Daniel R. Anthony, Jr.(I)
21,092
56.60%
 Ferdinand B. "Fred" Voiland, Sr.
12,574
33.74%
 W. E. Bush
3,601
9.66%
Nov 02, 1920 General Election
 Daniel R. Anthony, Jr.(I)
42,471
67.20%
 Julius B. Billard
20,730
32.80%
Nov 05, 1918 General Election
 Daniel R. Anthony, Jr.(I)
33,720
64.97%
 Frank E. Whitney
17,100
32.95%
 George Stahlman
1,083
2.09%
Nov 07, 1916 General Election
 Daniel R. Anthony, Jr.(I)
37,705
55.75%
 Herbert J. Corwine
23,272
34.41%
 Eva Harding
5,144
7.61%
 Charles A. Richardson
1,508
2.23%
Nov 03, 1914 General Election
 Daniel R. Anthony, Jr.(I)
31,539
51.64%
 J.B. Chapman
20,279
33.20%
 Sheffield Ingalls
9,259
15.16%
Nov 05, 1912 General Election
 Daniel R. Anthony, Jr.(I)
22,978
51.76%
 J.B. Chapman
20,646
46.51%
 H. B. Conwell
768
1.73%
Nov 08, 1910 General Election
 Daniel R. Anthony, Jr.(I)
21,852
72.32%
 J.B. Chapman
7,486
24.77%
 E.B. Keck
878
2.91%
Nov 03, 1908 General Election
 Daniel R. Anthony, Jr.(I)
27,792
57.56%
 F.M. Pearl
19,842
41.09%
 John F. Willetts
650
1.35%
May 23, 1907 Special Election
 Daniel R. Anthony, Jr.
6,978
84.06%
 Albert Kingsley
1,323
15.94%
Date Type Results
Nov 06, 1906 General Election
 Charles Curtis(I)
22,790
57.51%
 W. D. Webb
16,215
40.91%
 John F. Willits
567
1.43%
 W. W. Wiley
59
0.15%
Nov 08, 1904 General Election
 Charles Curtis(I)
25,376
57.81%
 A. M. Harvey
17,808
40.57%
 John F. Willits
714
1.63%
Nov 04, 1902 General Election
 Charles Curtis(I)
23,954
62.75%
 John E. Wagner
13,774
36.08%
 C. B. Harmon
443
1.16%
Nov 06, 1900 General Election
 Charles Curtis(I)
28,733
59.06%
 George Washington Glick
19,915
40.94%
Nov 08, 1898 General Election
 Charles Curtis
23,899
59.62%
 W. W. Price
16,187
40.38%
Date Type Results
Nov 03, 1896 General Election
 Case Broderick(I)
22,115
53.13%
 H. E. Ballou
19,513
46.87%
Nov 06, 1894 General Election
 Case Broderick(I)
19,202
54.20%
 H. C. Solomon
15,844
44.72%
 L. A. Stone
385
1.09%
Nov 08, 1892 General Election
 Case Broderick(I)
19,401
54.47%
 Fred J. Close
15,782
44.31%
 T. J. McCormick
276
0.77%
 Ed Carroll
161
0.45%
Nov 04, 1890 General Election
 Case Broderick
14,630
41.69%
 Thomas Moonlight
13,250
37.75%
 L.C. Clark
7,176
20.45%
 J.H. Woodhull
39
0.11%
Nov 06, 1888 General Election
 Edmund N. Morrill(I)
20,879
56.26%
 E.K. Townsend
14,536
39.17%
 A.J. Grover
1,253
3.38%
 H. Shumaker
444
1.20%
Nov 02, 1886 General Election
 Edmund N. Morrill(I)
17,347
55.33%
 E. Bierer
13,832
44.12%
 Thomas Scott
108
0.34%
 Unidentified Scattering
66
0.21%
Nov 04, 1884 General Election
 Edmund N. Morrill(I)
19,535
55.08%
 Thomas P. Fenton
15,934
44.92%
Date Type Results
Nov 07, 1882 General Election
 John A. Anderson(I)
41,251
68.33%
 Charles H. Moody
17,816
29.51%
 L.T. Smith
1,299
2.15%
Nov 02, 1880 General Election
 John A. Anderson(I)
48,599
61.80%
 C.C. Burnes
22,727
28.90%
 John Davis
7,318
9.31%
Nov 05, 1878 General Election
 John A. Anderson
30,457
59.61%
 J.R. McClure
14,919
29.20%
 E. Gale
5,716
11.19%
Nov 07, 1876 General Election
 William A. Phillips(I)
29,352
64.82%
 Thomas P. Fenton
15,642
34.55%
 Richard Wake
201
0.44%
 J. Wisebach
85
0.19%
Nov 03, 1874 General Election
 William A. Phillips(I)
20,087
60.17%
 Marcus J. Parrott
11,225
33.62%
 N. Green
2,074
6.21%

DISCUSSION
[Download as CSV]