Home About Chat Users Issues Party Candidates Polling Firms Media News Polls Calendar Key Races United States President Senate House Governors International

New User Account
"A comprehensive, collaborative elections resource." 
Email: Password:

  AL - District 01 - History
House of Representatives DETAILS
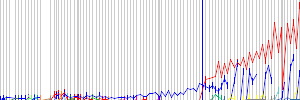
Parents > United States > Alabama > AL - District 01   Raw Vote Total:

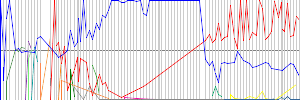
Percentages:

Website
Established March 04, 1833
Disbanded Still Active
Last ModifiedChronicler October 14, 2022 06:02am
Description

RACES [Don't Show Primaries]
Redistricting: Light Green=Added Territory, Red=Removed Territory,
Dark Green=Kept Territory
Date Type Results
Nov 05, 2024 General Election
 Tom Holmes
0
0.00%
 Barry Moore(I)
0
0.00%
Mar 05, 2024 Primary Election
 Tom Holmes
1
100.00%
Mar 05, 2024 Primary Election
 Barry Moore(I)
53,956
51.75%
 Jerry Carl(I)
50,312
48.25%
Date Type Results
Nov 08, 2022 General Election
 Jerry Carl(I)
140,592
83.61%
 Alexander Remrey
26,369
15.68%
  Write-In (W)
1,189
0.71%
Date Type Results
Nov 03, 2020 General Election
 Jerry Carl
211,825
64.37%
 James Averhart
116,949
35.54%
  Write-In (W)
301
0.09%
Jul 14, 2020 Primary Election
 James Averhart
15,840
56.69%
 Kiani Gardner
12,102
43.31%
Jul 14, 2020 Primary Election
 Jerry Carl
44,421
52.28%
 Bill Hightower
40,552
47.72%
Mar 03, 2020 Primary Election
 Kiani Gardner
22,962
44.07%
 James Averhart
21,022
40.35%
 Rick Collins
8,119
15.58%
Mar 03, 2020 Primary Election
 Jerry Carl
38,490
38.70%
 Bill Hightower
37,283
37.48%
 Chris Pringle
19,126
19.23%
 Wes Lambert
3,102
3.12%
 John Castorani
1,468
1.48%
Nov 06, 2018 General Election
 Bradley Byrne(I)
153,228
63.16%
 Robert Kennedy, Jr.
89,226
36.78%
  Write-In (W)
163
0.07%
Jun 05, 2018 Primary Election
 Robert Kennedy, Jr.
27,651
80.75%
 Lizzetta Hill McConnell
6,592
19.25%
Nov 08, 2016 General Election
 Bradley Byrne(I)
208,083
96.38%
  Write-In (W)
7,810
3.62%
Mar 01, 2016 Primary Election
 Bradley Byrne(I)
71,310
60.11%
 Dean Young
47,319
39.89%
Nov 04, 2014 General Election
 Bradley Byrne(I)
103,758
68.16%
 Burton LeFlore
48,278
31.71%
  Write-In (W)
198
0.13%
Dec 17, 2013 Special Election
 Bradley Byrne
36,042
70.66%
 Burton LeFlore
14,968
29.34%
Nov 05, 2013 Primary Election
 Bradley Byrne
38,150
52.49%
 Dean Young
34,534
47.51%
Sep 24, 2013 Primary Election
 Bradley Byrne
18,090
34.57%
 Dean Young
12,011
22.95%
 Chad Fincher
8,177
15.62%
 Quin Hillyer
7,260
13.87%
 Wells Griffith
5,758
11.00%
 Daniel Dyas
391
0.75%
 Jessica James
391
0.75%
  Sharon L. Powe
184
0.35%
 David "Thunder" Thornton
72
0.14%
Sep 24, 2013 Primary Election
 Burton LeFlore
3,129
70.20%
 Lula Albert-Kaigler
1,328
29.80%
Nov 06, 2012 General Election
 Jo Bonner(I)
196,374
97.86%
  Write-In (W)
4,302
2.14%
Mar 13, 2012 Primary Election
 Jo Bonner(I)
48,481
55.55%
 Dean Young
21,216
24.31%
 Pete Riehm
13,744
15.75%
 Peter Gounares
3,828
4.39%
Date Type Results
Nov 02, 2010 General Election
 Jo Bonner(I)
129,063
82.58%
 David M. Walter
26,357
16.87%
  Write-In (W)
861
0.55%
Jun 01, 2010 Primary Election
 Jo Bonner(I)
56,937
75.25%
 Peter Gounares
18,725
24.75%
Nov 04, 2008 General Election
 Jo Bonner(I)
210,660
98.27%
  Others (W)
3,707
1.73%
 Dick Coffee (W)
0
0.00%
Jun 03, 2008 Primary Election
 Tommy Fuller
1
100.00%
Nov 07, 2006 General Election
 Jo Bonner(I)
112,944
68.10%
 Vivian Beckerle
52,770
31.82%
  Write-In (W)
127
0.08%
Jun 06, 2006 Primary Election
 Vivian Beckerle
1
100.00%
Nov 02, 2004 General Election
 Jo Bonner(I)
161,067
63.12%
 Judy McCain Belk
93,938
36.81%
  Others (W)
159
0.06%
Nov 05, 2002 General Election
 Jo Bonner
108,102
60.50%
 Judy McCain Belk
67,507
37.78%
 Dick Coffee
2,957
1.65%
 Unidentified Scattering (W)
121
0.07%
Jun 25, 2002 Primary Election
 Judy McCain Belk
13,007
58.43%
 J. Don Foster
9,254
41.57%
Jun 25, 2002 Primary Election
 Jo Bonner
32,421
62.44%
 Tom Young
19,501
37.56%
Jun 04, 2002 Primary Election
 Judy McCain Belk
14,213
36.01%
 J. Don Foster
9,766
24.74%
 James O. Gordon
8,128
20.59%
 Don Chamberlain
3,774
9.56%
 Buzz Jordan
3,593
9.10%
Jun 04, 2002 Primary Election
 Jo Bonner
29,857
40.26%
 Tom Young
15,087
20.34%
 David Whetstone
10,997
14.83%
 Albert Lipscomb
7,429
10.02%
 Chris Pringle
6,001
8.09%
 Rusty Glover
4,374
5.90%
 Joe J. Gottler
411
0.55%
Date Type Results
Nov 07, 2000 General Election
 H.L. "Sonny" Callahan(I)
151,188
91.26%
 Dick Coffee
14,031
8.47%
  Others (W)
450
0.27%
Nov 03, 1998 General Election
 H.L. "Sonny" Callahan(I)
112,872
99.39%
  Others (W)
692
0.61%
Nov 05, 1996 General Election
 H.L. "Sonny" Callahan(I)
132,206
64.36%
 Don Womack
69,470
33.82%
 Bob Burns
3,311
1.61%
  Others (W)
430
0.21%
Nov 08, 1994 General Election
 H.L. "Sonny" Callahan(I)
103,431
67.26%
 Don Womack
50,227
32.66%
  Others (W)
109
0.07%
Jun 07, 1994 Primary Election
 Don Womack
20,409
51.71%
 Don Chamberlain
19,056
48.29%
Nov 03, 1992 General Election
 H.L. "Sonny" Callahan(I)
128,874
60.16%
 William A. Brewer
78,742
36.76%
 John R. Garrett
6,548
3.06%
  Others (W)
40
0.02%
Date Type Results
Nov 06, 1990 General Election
 H.L. "Sonny" Callahan(I)
82,185
99.58%
  Others (W)
345
0.42%
Nov 08, 1988 General Election
 H.L. "Sonny" Callahan(I)
115,173
59.27%
 John M. Tyson, Jr.
77,670
39.97%
 Kenneth Ament
1,483
0.76%
Nov 04, 1986 General Election
 H.L. "Sonny" Callahan(I)
94,649
100.00%
Nov 06, 1984 General Election
 H.L. "Sonny" Callahan
102,479
51.00%
 Frank McRight
98,455
49.00%
Sep 04, 1984 Primary Election
 Frank McRight
37,806
54.51%
 Dan Alexander
31,551
45.49%
Sep 03, 1984 Primary Election
 H.L. "Sonny" Callahan
17,118
60.53%
 William "Billy" Stoudenmire
10,985
38.84%
 Tom Sawyer
178
0.63%
Nov 02, 1982 General Election
 William "Jack" Edwards(I)
87,901
61.03%
 Steve Gudac
54,315
37.71%
 William "Bill" Springer
1,812
1.26%
Date Type Results
Nov 04, 1980 General Election
 William "Jack" Edwards(I)
111,089
94.77%
 Steve Smith
6,130
5.23%
Nov 07, 1978 General Election
 William "Jack" Edwards(I)
71,711
63.94%
 Lionel W. "Red" Noonan Sr.
40,450
36.06%
Sep 05, 1978 Primary Election
 Lionel W. "Red" Noonan Sr.
51,555
61.42%
 Billy Max Paul
32,388
38.58%
Nov 02, 1976 General Election
 William "Jack" Edwards(I)
98,257
62.52%
 Bill Davenport
58,906
37.48%
  Write-In (W)
7
0.00%
Nov 05, 1974 General Election
 William "Jack" Edwards(I)
60,710
59.48%
 Augusta Wilson
37,718
36.95%
 Mary McCarthy
3,638
3.56%
Nov 07, 1972 General Election
 William "Jack" Edwards(I)
104,606
76.52%
 O.W. "Bill" McCrory
24,357
17.82%
 Thomas McAboy, Jr.
7,747
5.67%
May 02, 1972 Primary Election
 O.W. "Bill" McCrory
38,956
69.84%
 Wallace P. Pruitt Jr.
16,825
30.16%
Date Type Results
Nov 03, 1970 General Election
 William "Jack" Edwards(I)
63,457
60.60%
 John Tyson Sr.
27,457
26.22%
 Noble Beasley
13,798
13.18%
Nov 05, 1968 General Election
 William "Jack" Edwards(I)
60,318
57.11%
 Arnold D. Debrow
40,593
38.44%
 Noble Beasley
4,679
4.43%
 Darius K. Rosco
24
0.02%
Nov 08, 1966 General Election
 William "Jack" Edwards(I)
58,515
65.76%
 Warren L. Finch
30,474
34.24%
May 31, 1966 Primary Election
 Warren L. Finch
33,739
51.23%
 Richard E. McPhearson
32,120
48.77%
May 03, 1966 Primary Election
 Richard E. McPhearson
30,155
37.63%
 Warren L. Finch
28,757
35.89%
 Will D. Haas
21,221
26.48%
Date Type Results
Nov 03, 1964 General Election
 William "Jack" Edwards
54,522
59.91%
 John Tyson Sr.
36,482
40.09%
May 19, 1964 Primary Election
 John Tyson Sr.
34,773
62.93%
 Charles S. Trimmier
20,483
37.07%
May 05, 1964 Primary Election
 John Tyson Sr.
35,722
48.06%
 Charles S. Trimmier
23,321
31.38%
 Clara Stone Fields
15,284
20.56%
Date Type Results
Nov 06, 1962 Appointment
 Carl A. Elliott(I)
1
100.00%
May 01, 1962 Primary Election
 Frank W. Boykin(I)
35,742
52.93%
 Pierre Pelham
31,779
47.07%
Nov 08, 1960 General Election
 Frank W. Boykin(I)
45,225
100.00%
May 03, 1960 Primary Election
 Frank W. Boykin(I)
42,314
78.99%
 Charles Kilborn
11,255
21.01%
Nov 04, 1958 General Election
 Frank W. Boykin(I)
23,099
100.00%
Nov 06, 1956 General Election
 Frank W. Boykin(I)
31,519
100.00%
May 01, 1956 Primary Election
 Frank W. Boykin(I)
31,494
72.68%
 James T. Hamrick
11,840
27.32%
Nov 02, 1954 General Election
 Frank W. Boykin(I)
27,462
100.00%
Nov 04, 1952 General Election
 Frank W. Boykin(I)
30,758
100.00%
May 06, 1952 Primary Election
 Frank W. Boykin(I)
21,059
50.15%
 Ben N. Glover
14,678
34.95%
 Joe Thompson
6,256
14.90%
Nov 07, 1950 General Election
 Frank W. Boykin(I)
14,206
100.00%
Nov 02, 1948 General Election
 Frank W. Boykin(I)
19,778
100.00%
Nov 05, 1946 General Election
 Frank W. Boykin(I)
12,448
100.00%
Nov 07, 1944 General Election
 Frank W. Boykin(I)
19,082
100.00%
Nov 03, 1942 General Election
 Frank W. Boykin(I)
5,600
100.00%
Nov 05, 1940 General Election
 Frank W. Boykin(I)
25,993
100.00%
Nov 08, 1938 General Election
 Frank W. Boykin(I)
9,853
100.00%
Nov 03, 1936 General Election
 Frank W. Boykin(I)
23,421
99.99%
 Frank Bunkley (W)
2
0.01%
May 05, 1936 Primary Election
 Frank W. Boykin(I)
15,716
58.93%
 Frank Bunkley
10,955
41.07%
Jul 30, 1935 Special Election
 Frank W. Boykin
1
100.00%
Nov 06, 1934 General Election
 John McDuffie(I)
13,076
99.70%
 Andrew M. Forsman
39
0.30%
Nov 08, 1932 General Election
 John McDuffie(I)
20,675
100.00%
Date Type Results
Nov 04, 1930 General Election
 John McDuffie(I)
16,839
100.00%
Nov 06, 1928 General Election
 John McDuffie(I)
16,712
100.00%
Nov 02, 1926 General Election
 John McDuffie(I)
8,297
84.02%
 Aubrey Boyles
1,578
15.98%
Nov 04, 1924 General Election
 John McDuffie(I)
9,932
86.10%
 Frank J. Thompson
1,604
13.90%
Nov 07, 1922 General Election
 John McDuffie(I)
13,960
100.00%
Nov 02, 1920 General Election
 John McDuffie(I)
12,978
98.74%
 C.H. Hutchinson
165
1.26%
Nov 05, 1918 General Election
 John McDuffie
3,721
100.00%
Nov 07, 1916 General Election
 Oscar L. Gray(I)
8,538
100.00%
Date Type Results
Nov 03, 1914 General Election
 Oscar L. Gray
4,609
100.00%
Nov 05, 1912 General Election
 George W. Taylor(I)
7,414
97.21%
 W.M. Doyle
213
2.79%
Date Type Results
Nov 08, 1910 General Election
 George W. Taylor(I)
7,077
97.05%
 Louis Edelman
147
2.02%
 L.F. Rush
68
0.93%
Date Type Results
Nov 08, 1910 General Election
 George W. Taylor(I)
7,077
97.05%
 Louis Edelman
147
2.02%
 L.F. Rush
68
0.93%
Date Type Results
Nov 06, 1908 General Election
 George W. Taylor(I)
7,457
100.00%
Date Type Results
Nov 06, 1908 General Election
 George W. Taylor(I)
7,457
100.00%
Date Type Results
Nov 06, 1906 General Election
 George W. Taylor(I)
3,592
100.00%
Date Type Results
Nov 06, 1906 General Election
 George W. Taylor(I)
3,592
100.00%
Date Type Results
Nov 08, 1904 General Election
 George W. Taylor(I)
7,686
100.00%
Date Type Results
Nov 08, 1904 General Election
 George W. Taylor(I)
7,686
100.00%
Date Type Results
Nov 04, 1902 General Election
 George W. Taylor(I)
5,364
89.79%
 Ebenezer B. Hubbard
545
9.12%
 G.H. Wilkerson
65
1.09%
Date Type Results
Nov 04, 1902 General Election
 George W. Taylor(I)
5,364
89.79%
 Ebenezer B. Hubbard
545
9.12%
 G.H. Wilkerson
65
1.09%
Date Type Results
Nov 06, 1900 General Election
 George W. Taylor(I)
9,804
82.73%
 John W. Schell
2,046
17.27%
Nov 08, 1898 General Election
 George W. Taylor(I)
5,886
84.73%
 A.N. Johnson
1,061
15.27%
Nov 03, 1896 General Election
 George W. Taylor
11,890
70.50%
 Frank H. Threatt
4,281
25.38%
 Emory C. Stearnes
648
3.84%
 A.J. Hern
47
0.28%
Nov 06, 1894 General Election
 Richard H. Clarke(I)
6,314
76.89%
 Guy C. Sibley
1,898
23.11%
Nov 08, 1892 General Election
 Richard H. Clarke(I)
12,514
60.50%
 William Mason
7,156
34.60%
 Frank H. Threatt
1,015
4.91%
Date Type Results
Nov 04, 1890 General Election
 Richard H. Clarke(I)
10,071
69.89%
 Frank H. Threatt
2,448
16.99%
 Andrew J. Warner
1,890
13.12%
Nov 06, 1888 General Election
 Richard H. Clarke
11,594
62.00%
 Frank H. Threatt
7,105
38.00%
Nov 02, 1886 General Election
 James T. Jones(I)
4,220
99.62%
 Unidentified Scattering
16
0.38%
Nov 04, 1884 General Election
 James T. Jones(I)
8,871
58.08%
 Frank H. Threatt
6,403
41.92%
Date Type Results
Jul 03, 1883 Special Election
 James T. Jones
6,413
81.05%
 Philip Joseph
1,499
18.95%
Nov 07, 1882 General Election
 Thomas Hord Herndon(I)
9,603
57.39%
 Luther R. Smith
7,130
42.61%
Nov 02, 1880 General Election
 Thomas Hord Herndon(I)
10,027
53.78%
 James Gillett
5,595
30.01%
 Frank H. Threatt
2,303
12.35%
 George M. Mott
720
3.86%
Nov 05, 1878 General Election
 Thomas Hord Herndon
6,577
69.10%
 Warner Bailey
2,941
30.90%
Nov 07, 1876 General Election
 James T. Jones
10,582
49.25%
 Frederick G. Bromberg
8,771
40.82%
 William W. Turner
2,132
9.92%
Date Type Results
Nov 03, 1874 General Election
 Jeremiah Haralson
19,551
53.56%
 Frederick G. Bromberg(I)
16,953
46.44%
Nov 05, 1872 General Election
 Frederick G. Bromberg
15,607
43.59%
 Benjamin S. Turner(I)
13,174
36.79%
 Philip Joseph
7,024
19.62%
Date Type Results
Nov 08, 1870 General Election
 Benjamin S. Turner
18,226
57.51%
 Samuel J. Cummings
13,466
42.49%
Aug 02, 1869 General Election
 Alfred E. Buck
14,191
54.02%
 William D. Mann
12,080
45.98%
Feb 08, 1868 General Election
 Francis W. Kellogg
16,097
100.00%
No Map In System
Date Type Results
Nov 06, 1865 General Election
 Charles Langdon
4,034
63.84%
 Thomas J. Matthews
1,386
21.93%
 S. B. Cleveland
899
14.23%
Date Type Results
Aug 01, 1859 General Election
 James A. Stallworth(I)
7,352
63.32%
 F.B. Shepard
4,258
36.68%
Aug 03, 1857 General Election
 James A. Stallworth
7,017
61.95%
 John McCaskill
4,310
38.05%
Aug 06, 1855 General Election
 Percy Walker
5,653
52.40%
 James A. Stallworth
5,135
47.60%
Date Type Results
Aug 08, 1853 General Election
 Philip Phillips
4,880
50.53%
 E. Lockwood
4,777
49.47%
Aug 04, 1851 General Election
 John Bragg
6,073
58.81%
 Charles Langdon
4,254
41.19%
Aug 06, 1849 General Election
 William J. Alston
4,922
51.22%
 C.C. Sellers
4,688
48.78%
Aug 02, 1847 General Election
 John Gayle
5,050
52.94%
 John Taylor
4,490
47.06%
Aug 04, 1845 General Election
 Edmund Strother Dargan
4,961
51.62%
 William D. Dunn
4,650
48.38%
Aug 07, 1843 General Election
 James Dellet
4,843
50.71%
 Henry Goldthwaite
4,708
49.29%
Date Type Results
Aug 05, 1839 General Election
 Reuben Chapman(I)
7,384
100.00%
Aug 07, 1837 General Election
 Reuben Chapman(I)
7,599
81.35%
 Gabriel Moore
1,742
18.65%
Aug 03, 1835 General Election
 Reuben Chapman
4,403
47.78%
 Thomas D. Glascock
2,993
32.48%
 Robert T. Scott
1,819
19.74%
Aug 05, 1833 General Election
 Clement C. Clay
1,310
100.00%

DISCUSSION
[Download as CSV]