Home About Chat Users Issues Party Candidates Polling Firms Media News Polls Calendar Key Races United States President Senate House Governors International

New User Account
"A comprehensive, collaborative elections resource." 
Email: Password:

  Auditor - History
State Government DETAILS
Parents > United States > Iowa > Auditor   Raw Vote Total:

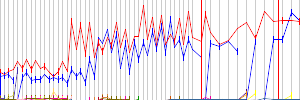
Percentages:

Website
Established 00, 0000
Disbanded Still Active
Last ModifiedRP November 12, 2002 08:34pm
Description

RACES [Show Primaries]
No Map In System
Date Type Results
Nov 08, 2022 General Election
 Rob Sand(I)
600,719
50.09%
 Todd Halbur
597,826
49.84%
  Write-In (W)
826
0.07%
Nov 06, 2018 General Election
 Rob Sand
660,169
50.96%
 Mary Mosiman(I)
601,320
46.42%
 Fred Perryman
33,421
2.58%
  Write-In (W)
458
0.04%
Nov 04, 2014 General Election
 Mary Mosiman(I)
604,103
56.88%
 Jonathan Neiderbach
456,525
42.98%
  Write-In (W)
1,477
0.14%
May 13, 2013 Appointment
 Mary Mosiman
1
100.00%
Nov 02, 2010 General Election
 David A. Vaudt(I)
597,721
56.43%
 Jon Murphy
460,493
43.48%
  Write-In (W)
924
0.09%
Nov 07, 2006 General Election
 David A. Vaudt(I)
669,434
98.83%
  Write-In
7,916
1.17%
Nov 05, 2002 General Election
 David A. Vaudt
464,469
48.58%
 Patrick J. Deluhery
442,040
46.23%
 Christy Ann Welty
49,206
5.15%
  Others
440
0.05%
Nov 03, 1998 General Election
 Richard D. Johnson(I)
588,079
85.69%
 Ronn Young
56,635
8.25%
 William W. Graff
40,537
5.91%
  Others (W)
1,052
0.15%
Nov 08, 1994 General Election
 Richard D. Johnson(I)
541,932
59.54%
 Dan Gray
367,722
40.40%
  Write-In
495
0.05%
Nov 06, 1990 General Election
 Richard D. Johnson(I)
448,898
50.44%
 Beverly Dickerson
440,798
49.53%
  Write-In
268
0.03%
Nov 04, 1986 General Election
 Richard D. Johnson(I)
419,088
50.74%
 Beverly Dickerson
406,747
49.25%
  Write-In
73
0.01%
Nov 02, 1982 General Election
 Richard D. Johnson(I)
511,559
54.11%
 Tom Slockett
429,938
45.48%
 Anne R. Koloc
3,838
0.41%
  Write-In (W)
15
0.00%
Nov 04, 1980 General Election
 Richard D. Johnson(I)
647,299
97.37%
 Thomas Oliver
17,287
2.60%
  Write-In (W)
175
0.03%
Jan 26, 1979 Appointment
 Richard D. Johnson
1
100.00%
Nov 07, 1978 General Election
 Lloyd R. Smith(I)
446,604
57.97%
 John B. Brunow
320,884
41.65%
 Thomas Oliver
2,920
0.38%
  Write-In (W)
15
0.00%
Nov 05, 1974 General Election
 Lloyd R. Smith(I)
470,751
55.04%
 F. Harold Forrett
384,439
44.95%
  Write-In (W)
32
0.00%
Nov 07, 1972 General Election
 Lloyd R. Smith(I)
668,158
59.09%
 F. Harold Forrett
462,582
40.91%
  Write-In (W)
6
0.00%
Nov 03, 1970 General Election
 Lloyd R. Smith
422,622
56.64%
 Donald E. Linduski
323,510
43.36%
  Write-In (W)
2
0.00%
Nov 05, 1968 General Election
 Lloyd R. Smith(I)
618,400
57.35%
 Donald J. Kelly
458,542
42.52%
 A. J. Buchholz
1,376
0.13%
  Write-In (W)
1
0.00%
Nov 08, 1966 General Election
 Lloyd R. Smith
442,063
52.60%
 Lorne E. Worthington(I)
398,377
47.40%
  Write-In (W)
1
0.00%
Nov 03, 1964 General Election
 Lorne E. Worthington
609,392
55.15%
 Chet B. Akers(I)
493,396
44.65%
 Alvin E. Eliason
2,192
0.20%
  Write-In (W)
2
0.00%
Nov 06, 1962 General Election
 Chet B. Akers(I)
424,373
54.32%
 Robert Conner
356,814
45.68%
Nov 08, 1960 General Election
 Chet B. Akers(I)
638,727
53.40%
 Robert E. Hutte
557,375
46.60%
Nov 08, 1958 General Election
 Chet B. Akers(I)
412,616
51.44%
 Rex Weddle
389,481
48.56%
Nov 08, 1956 General Election
 Chet B. Akers(I)
629,148
54.94%
 George J. Eischeid
515,954
45.06%
Nov 02, 1954 General Election
 Chet B. Akers(I)
460,094
57.41%
 Rex Weddle
341,313
42.59%
Nov 04, 1952 General Election
 Chet B. Akers(I)
720,584
62.34%
 Rex Weddle
435,387
37.66%
Nov 07, 1950 General Election
 Chet B. Akers(I)
480,909
60.43%
 Neil B. Little
310,967
39.07%
 L. E. Gifford
3,272
0.41%
 John P. Lynch
711
0.09%
Nov 02, 1948 General Election
 Chet B. Akers(I)
484,509
52.41%
 John L. Keller
439,934
47.59%
Nov 05, 1946 General Election
 Chet B. Akers(I)
361,888
62.05%
 William A. Yager
218,315
37.44%
 R. T. Banks
2,979
0.51%
Nov 07, 1944 General Election
 Chet B. Akers(I)
538,388
55.61%
 Peter J. Kies
425,916
43.99%
 L. E. Gifford
2,902
0.30%
 Annie M. Prescott
988
0.10%
Nov 03, 1942 General Election
 Chet B. Akers(I)
400,046
62.02%
 W. M. Shaw
242,556
37.61%
 A. G. Peterson
1,718
0.27%
 John P. Lynch
675
0.10%
Nov 05, 1940 General Election
 Chet B. Akers(I)
589,447
54.08%
 W. M. Shaw
499,144
45.79%
 George W. Swan
1,425
0.13%
Nov 08, 1938 General Election
 Chet B. Akers
411,986
52.89%
 Charles W. Storms(I)
358,800
46.06%
 Carl Jorgensen
5,427
0.70%
 Ernest R. Quick
1,756
0.23%
 J. E. Lombard
1,015
0.13%
Nov 03, 1936 General Election
 Charles W. Storms(I)
533,300
51.85%
 Frank M. Hanson
477,858
46.46%
 Herman O. Hansen
16,300
1.58%
 Francis Gordon
1,049
0.10%
Nov 06, 1934 General Election
 Charles W. Storms(I)
428,252
51.85%
 Frank M. Hanson
368,559
44.63%
 Ernest R. Quick
17,999
2.18%
 J. Alvin Mitchell
7,854
0.95%
 E. O. Weik
1,829
0.22%
 William Levine
1,391
0.17%
Nov 08, 1932 General Election
 Charles W. Storms
470,855
51.98%
 Karl W. Fischer
434,969
48.02%
 J. W. Duke
0
0.00%
 Caroline Dunham
0
0.00%
 J. K. Barnes
0
0.00%
 Mabel K. Wilson
0
0.00%
Nov 04, 1930 General Election
 James W. Long(I)
325,272
64.73%
 Charles W. Storms
177,239
35.27%
 Robert Anderson
0
0.00%
 Roy M. Wright
0
0.00%
Nov 06, 1928 General Election
 James W. Long(I)
588,862
65.81%
 Anna B. Lawther
305,920
34.19%
 Madison Warder
0
0.00%
Nov 02, 1926 General Election
 James W. Long
353,643
72.27%
 E. J. Riegel
135,671
27.73%
 Alfred Phelps
0
0.00%
Nov 02, 1924 General Election
 James C. McClune
564,237
72.25%
 E. T. Likes
216,767
27.75%
Nov 07, 1922 General Election
 Glenn C. Haynes(I)
383,931
68.49%
 V. E. Herbert
176,627
31.51%
Nov 02, 1920 General Election
 Glenn C. Haynes
594,084
70.71%
 John R. Rude
235,065
27.98%
 Henry Wenner
10,082
1.20%
 Julius H. Schneider
936
0.11%
  Write-In (W)
21
0.00%
Nov 05, 1918 General Election
 Frank S. Shaw(I)
216,871
60.98%
 Guy Mark Gillette
127,307
35.80%
 George M. Dowell
10,120
2.85%
 Carl S. Lewis
1,337
0.38%
Nov 07, 1916 General Election
 Frank S. Shaw(I)
289,522
61.06%
 John B. Keefe
171,022
36.07%
 T. H. Angell
9,124
1.92%
 Morris Bailey
3,124
0.66%
 Jerome Smith
1,398
0.29%
Nov 03, 1914 General Election
 Frank S. Shaw
215,676
53.51%
 George Phillips
157,353
39.04%
 Bruce Francis
14,649
3.63%
 G. S. Nelson
9,265
2.30%
 C. M. Kelley
6,137
1.52%
Nov 05, 1912 General Election
 John L. Bleakly(I)
181,698
41.00%
 J. A. Sinclair
171,594
38.72%
 Christian F. Meier
67,810
15.30%
 C. T. Bowman
15,020
3.39%
 C. H. Culley
7,088
1.60%
Nov 08, 1910 General Election
 John L. Bleakly(I)
210,792
54.46%
 John W. Blake
158,208
40.87%
 Fred Jensen
9,466
2.45%
 William P. Sopher
8,596
2.22%
Nov 03, 1908 General Election
 John L. Bleakly
256,329
54.58%
 Charles E. Munroe
197,083
41.97%
 John D. Collins
8,658
1.84%
 Ernest Pierce
7,088
1.51%
 James E. Danek
247
0.05%
 Warner Starr
201
0.04%
Nov 06, 1906 General Election
 Beryl F. Carroll(I)
236,073
57.79%
 Charles E. Munroe
155,973
38.18%
 Pauline M. Townsend
8,504
2.08%
 J. S. Ward
7,548
1.85%
 J. N. Martin
383
0.09%
Nov 08, 1904 General Election
 Beryl F. Carroll(I)
302,620
62.75%
 Edgar F. Medary
153,062
31.74%
 Carrie Johnson Triller
13,531
2.81%
 J. D. C. McFarland
11,460
2.38%
 Richard A. Feist
1,580
0.33%
Nov 04, 1902 General Election
 Beryl F. Carroll
228,195
58.00%
 James S. McLuen
149,262
37.94%
 John W. Leedy
9,710
2.47%
 T. J. Grant
6,280
1.60%
Nov 06, 1900 General Election
 Frank F. Merriam(I)
305,644
57.90%
 J. M. Gibson
209,593
39.70%
 C. H. Lockins
9,082
1.72%
 W. T. Beals
2,523
0.48%
 R. Weller
617
0.12%
 B. H. Williams
277
0.05%
 Charles W. Baker
156
0.03%

DISCUSSION
[Download as CSV]