|
|
"A comprehensive, collaborative elections resource."
|
PA - District 01 - History
 | House of Representatives DETAILS |
|
|
| Parents |
> United States > Pennsylvania > PA - District 01
|
|
Raw Vote Total:
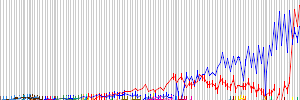
Percentages:

|
| Website | |
| Established | March 04, 1791 |
| Disbanded | Still Active |
| Last Modified | RP April 29, 2011 07:12pm |
| Description | |
|
Redistricting: Light Green=Added Territory, Red=Removed Territory, Dark Green=Kept Territory
| |
|
| |
|
| |
|
| |
|
| |
|
| |
|
| |
|
| |
|
| |
|
| |
|
| |
|
| |
|
| |
|
| |
|
| |
|
| |
|
| |
|
| |
|
| |
|
| |
|
| |
|
| |
|
| |
|
| |
|
| |
|
| |
|
| |
|
|
| Date |
Type |
Results |
| Oct 10, 1820 |
General Election |
|
| Oct 13, 1818 |
General Election |
|
| Oct 08, 1816 |
General Election |
| | Adam Seybert
6,054
13.25%
|
| William Anderson
6,001
13.14%
|
| John Sergeant(I)
5,414
11.85%
|
| Joseph Hopkinson(I)
5,327
11.66%
|
| William Milnor(I)
5,305
11.61%
|
| Samuel Edwards
5,259
11.51%
|
| Jacob Sommer
3,807
8.34%
|
| | | John Conard
3,516
7.70%
|
| William J. Duane
2,744
6.01%
|
| Thomas Forrest
2,247
4.92%
|
|
| Oct 10, 1815 |
Special Election |
|
| Oct 11, 1814 |
General Election |
|
| Oct 13, 1812 |
General Election |
|
|
|
| |
|
| |
|
| |
|
[Download as CSV]
|
