Home About Chat Users Issues Party Candidates Polling Firms Media News Polls Calendar Key Races United States President Senate House Governors International

New User Account
"A comprehensive, collaborative elections resource." 
Email: Password:

  MA - District 02 - History
House of Representatives DETAILS
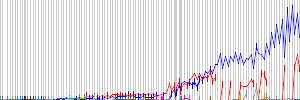
Parents > United States > Massachusetts > MA - District 02   Raw Vote Total:

Percentages:

Website
Established March 04, 1789
Disbanded Still Active
Last ModifiedRP September 10, 2013 08:40pm
DescriptionKnown as the 2nd Western District from 1795 to 1803, the "Essex North" district from 1803 to 1813 and the "Essex South" district from 1813 to 1833

RACES [Don't Show Primaries]
Redistricting: Light Green=Added Territory, Red=Removed Territory,
Dark Green=Kept Territory
Date Type Results
Nov 05, 2024 General Election
  Democratic Primary Winner
0
0.00%
  Republican Primary Winner
0
0.00%
Sep 03, 2024 Primary Election
 James P. McGovern(I)
0
0.00%
Nov 08, 2022 General Election
 James P. McGovern(I)
180,639
66.20%
 Jeffrey A. Sossa-Paquette
91,956
33.70%
  Write-In (W)
276
0.10%
Date Type Results
Nov 03, 2020 General Election
 James P. McGovern(I)
249,854
65.33%
 Tracy Lyn Lovvorn
132,220
34.57%
  Write-In (W)
378
0.10%
Sep 01, 2020 Primary Election
 James P. McGovern(I)
121,645
99.44%
  Write-In (W)
686
0.56%
Sep 01, 2020 Primary Election
 Tracy Lyn Lovvorn
26,456
99.10%
  Write-In (W)
241
0.90%
Nov 06, 2018 General Election
 James P. McGovern(I)
191,332
67.16%
 Tracy Lyn Lovvorn
93,391
32.78%
  Write-In (W)
170
0.06%
Sep 04, 2018 Primary Election
 Tracy Lyn Lovvorn
15,792
60.58%
 Kevin William Powers
10,170
39.01%
  Write-In (W)
105
0.40%
Sep 04, 2018 Primary Election
 James P. McGovern(I)
53,848
99.17%
Nov 08, 2016 General Election
 James P. McGovern(I)
275,487
98.24%
  Write-In (W)
4,924
1.76%
Sep 08, 2016 Primary Election
 James P. McGovern(I)
21,562
99.24%
  Write-In (W)
166
0.76%
Nov 04, 2014 General Election
 James P. McGovern(I)
169,640
98.20%
  Others (W)
3,105
1.80%
Nov 06, 2012 General Election
 James P. McGovern(I)
259,257
98.45%
  Others (W)
4,078
1.55%
Sep 06, 2012 Primary Election
 James P. McGovern(I)
24,375
91.35%
 William B. Feegbeh
2,265
8.49%
  Others (W)
44
0.16%
Date Type Results
Nov 02, 2010 General Election
 Richard E. Neal(I)
122,751
57.33%
 Thomas A. Wesley
91,209
42.60%
  Others (W)
164
0.08%
Sep 14, 2010 Primary Election
 Thomas A. Wesley
10,780
56.08%
 Jay S. Fleitman
8,403
43.71%
  Others (W)
40
0.21%
Nov 04, 2008 General Election
 Richard E. Neal(I)
234,369
98.47%
  Others (W)
3,631
1.53%
Sep 16, 2008 Primary Election
 Richard E. Neal(I)
30,017
98.81%
  Write-In
360
1.19%
Nov 07, 2006 General Election
 Richard E. Neal(I)
164,939
98.65%
  Write-In
2,254
1.35%
Nov 02, 2004 General Election
 Richard E. Neal(I)
217,682
98.73%
  Write-In
2,802
1.27%
Sep 14, 2004 Primary Election
 Richard E. Neal(I)
29,707
99.14%
  Write-In (W)
259
0.86%
Sep 14, 2004 Primary Election
 No Candidate Filed
0
0.00%
  Others (W)
623
100.00%
Nov 05, 2002 General Election
 Richard E. Neal(I)
153,387
99.13%
  Others
1,341
0.87%
Date Type Results
Nov 07, 2000 General Election
 Richard E. Neal(I)
196,670
98.91%
  Others
2,176
1.09%
Sep 19, 2000 Primary Election
 Richard E. Neal(I)
20,253
86.45%
 Joseph R. Fountain
3,149
13.44%
  Others (W)
26
0.11%
Nov 03, 1998 General Election
 Richard E. Neal(I)
130,550
98.95%
  Others
1,383
1.05%
Nov 05, 1996 General Election
 Richard E. Neal(I)
162,995
71.67%
 Mark Steele
49,885
21.94%
 Scott Andrichak
9,181
4.04%
 Richard Kaynor
5,124
2.25%
  Others
226
0.10%
Nov 08, 1994 General Election
 Richard E. Neal(I)
117,178
58.55%
 John M. Briare
72,732
36.34%
 Kate Ross
10,167
5.08%
  Others
46
0.02%
Nov 03, 1992 General Election
 Richard E. Neal(I)
131,215
53.09%
 Anthony W. Ravosa, Jr.
76,795
31.07%
 Thomas R. Sheehan
38,963
15.76%
  Others (W)
190
0.08%
Sep 15, 1992 Primary Election
 Richard E. Neal(I)
30,370
47.72%
 Kateri B. Walsh
21,709
34.11%
 Charles A. Platten, Jr.
11,513
18.09%
  Write-In (W)
49
0.08%
Date Type Results
Nov 06, 1990 General Election
 Richard E. Neal(I)
134,152
99.79%
  Others (W)
277
0.21%
Sep 18, 1990 Primary Election
 Richard E. Neal(I)
51,615
63.62%
 Theodore E. DiMauro
29,520
36.38%
Nov 08, 1988 General Election
 Richard E. Neal
156,262
80.25%
 Louis R. Godena
38,446
19.75%
Nov 04, 1986 General Election
 Edward P. "Ed" Boland(I)
91,033
65.94%
 Brian P. Lees
47,022
34.06%
  Others (W)
7
0.01%
Sep 16, 1986 Primary Election
 Brian P. Lees
4,174
69.51%
 Thomas P. Swank
1,802
30.01%
  Scattering
29
0.48%
Nov 06, 1984 General Election
 Edward P. "Ed" Boland(I)
132,693
68.70%
 Thomas P. Swank
60,463
31.30%
Sep 18, 1984 Primary Election
 Edward P. "Ed" Boland(I)
33,771
64.70%
 Robert B. Shaffer
14,010
26.84%
 Robert E. Shaw
4,416
8.46%
  Scattering (W)
2
0.00%
Nov 02, 1982 General Election
 Edward P. "Ed" Boland(I)
118,215
72.63%
 Thomas P. Swank
44,544
27.37%
Date Type Results
Nov 04, 1980 General Election
 Edward P. "Ed" Boland(I)
120,711
67.20%
 Thomas P. Swank
38,672
21.53%
 John B. Aubuchon
20,247
11.27%
Sep 16, 1980 Primary Election
 Edward P. "Ed" Boland(I)
38,811
71.07%
 Paul M. Kozikowski
11,999
21.97%
 Alwin E. Hopfmann
3,784
6.93%
  Scattering
14
0.03%
Nov 07, 1978 General Election
 Edward P. "Ed" Boland(I)
101,570
72.82%
 Thomas P. Swank
37,881
27.16%
  Others
28
0.02%
Nov 02, 1976 General Election
 Edward P. "Ed" Boland(I)
134,408
72.36%
 Thomas P. Swank
41,563
22.38%
 John McCarthy
9,776
5.26%
Nov 05, 1974 General Election
 Edward P. "Ed" Boland(I)
105,763
99.97%
  Others (W)
30
0.03%
Nov 07, 1972 General Election
 Edward P. "Ed" Boland(I)
137,616
99.99%
  Others (W)
9
0.01%
Date Type Results
Nov 03, 1970 General Election
 Edward P. "Ed" Boland(I)
111,430
99.98%
  Others (W)
18
0.02%
Nov 05, 1968 General Election
 Edward P. "Ed" Boland(I)
126,485
73.65%
 Frederick M. Whitney Jr.
45,262
26.35%
Sep 17, 1968 Primary Election
 Edward P. "Ed" Boland(I)
42,100
62.71%
 Charles V. Ryan
25,038
37.29%
Date Type Results
Nov 08, 1966 General Election
 Edward P. "Ed" Boland(I)
95,985
100.00%
Nov 03, 1964 General Election
 Edward P. "Ed" Boland(I)
125,894
100.00%
Nov 06, 1962 General Election
 Edward P. "Ed" Boland(I)
92,340
67.79%
 Samuel S. Rodman, Jr.
43,873
32.21%
Date Type Results
Nov 08, 1960 General Election
 Edward P. "Ed" Boland(I)
135,815
100.00%
Nov 04, 1958 General Election
 Edward P. "Ed" Boland(I)
103,079
100.00%
Nov 06, 1956 General Election
 Edward P. "Ed" Boland(I)
103,563
61.22%
 Foster W. Doty
65,598
38.78%
Nov 02, 1954 General Election
 Edward P. "Ed" Boland(I)
77,899
59.64%
 Vernon Bradley
52,725
40.36%
Nov 04, 1952 General Election
 Edward P. "Ed" Boland
88,424
51.80%
 Troy T. Murray
81,847
47.95%
 Anthony D. Hall
432
0.25%
Sep 16, 1952 Primary Election
 Edward P. "Ed" Boland
14,580
49.82%
 J. Frank Murphy
6,915
23.63%
 Lionel G. Angers
4,970
16.98%
 Frank Hurley
2,800
9.57%
Nov 07, 1950 General Election
 Foster Furcolo(I)
76,497
54.64%
 Chester T. Skibinski
63,493
45.36%
Nov 02, 1948 General Election
 Foster Furcolo
81,775
54.87%
 Charles R. Clason(I)
67,267
45.13%
Nov 05, 1946 General Election
 Charles R. Clason(I)
59,754
51.42%
 Foster Furcolo
56,459
48.58%
Jun 18, 1946 Primary Election
 Foster Furcolo
4,903
28.28%
 Raymond F. O'Connell
3,959
22.83%
 J. Frank Murphy
3,000
17.30%
 Dallas Lore Sharp, Jr.
1,929
11.12%
 Michael W. Albano
1,317
7.60%
 Francis M. Collins
1,268
7.31%
 Timothy F. Flaherty
558
3.22%
  George W. McCarthy
405
2.34%
  Write-In (W)
1
0.01%
Nov 07, 1944 General Election
 Charles R. Clason(I)
75,571
55.66%
 Michael W. Albano
60,195
44.34%
  Others
5
0.00%
Nov 03, 1942 General Election
 Charles R. Clason(I)
58,781
61.58%
 John J. Granfield
36,675
38.42%
Date Type Results
Nov 05, 1940 General Election
 Charles R. Clason(I)
76,373
58.39%
 Patrick A. Doyle
54,428
41.61%
Nov 08, 1938 General Election
 Charles R. Clason(I)
68,106
61.89%
 James F. Egan
41,935
38.11%
Nov 03, 1936 General Election
 Charles R. Clason
57,618
48.95%
 Agnes C. Reavey
52,197
44.34%
 Harry A. Custis
3,993
3.39%
 S. Ralph Harlow
2,245
1.91%
 Donald F. Moynahan
1,654
1.41%
  Others (W)
5
0.00%
Nov 06, 1934 General Election
 William J. Granfield(I)
47,894
51.24%
 Charles R. Clason
42,495
45.47%
 S. Ralph Harlow
3,076
3.29%
Nov 08, 1932 General Election
 William J. Granfield(I)
52,346
49.94%
 Joshua L. Brooks
47,920
45.72%
 S. Ralph Harlow
4,548
4.34%
  Scattering
1
0.00%
Date Type Results
Nov 04, 1930 General Election
 William J. Granfield(I)
46,432
55.49%
 Joshua L. Brooks
37,247
44.51%
  Write-In (W)
1
0.00%
Feb 11, 1930 Special Election
 William J. Granfield
31,169
54.63%
 Frederick D. Griggs
24,722
43.33%
 Whitfield Reid
1,082
1.90%
 William H. Feiker (W)
77
0.13%
  Others (W)
9
0.02%
Nov 06, 1928 General Election
 William Kirk Kaynor
52,344
54.41%
 John D. O'Connor
43,856
45.59%
Nov 02, 1926 General Election
 Henry L. Bowles(I)
36,333
63.99%
 John Hall
20,450
36.01%
Date Type Results
Sep 29, 1925 Special Election
 Henry L. Bowles
12,702
58.34%
 Roland D. Sawyer
9,067
41.65%
  Others (W)
2
0.01%
Nov 04, 1924 General Election
 George B. Churchill
41,126
57.26%
 Joseph E. Kerigan
30,703
42.74%
Nov 07, 1922 General Election
 Frederick H. Gillett(I)
28,639
59.65%
 Joseph E. Kerigan
19,376
40.35%
Nov 02, 1920 General Election
 Frederick H. Gillett(I)
47,658
99.92%
 Unidentified Scattering (W)
36
0.08%
Nov 05, 1918 General Election
 Frederick H. Gillett(I)
20,277
99.93%
  Others
15
0.07%
Nov 07, 1916 General Election
 Frederick H. Gillett(I)
20,064
60.25%
 Theobald M. Connor
11,894
35.72%
 George H. Wrenn
1,343
4.03%
Date Type Results
Nov 03, 1914 General Election
 Frederick H. Gillett(I)
15,635
56.26%
 Edward M. Lewis
11,252
40.49%
 Thomas F. Loorem
904
3.25%
Nov 05, 1912 General Election
 Frederick H. Gillett(I)
12,301
42.81%
 William G. McKechnie
10,940
38.07%
 Thomas L. Hisgen
5,442
18.94%
  Others (W)
51
0.18%
Date Type Results
Nov 08, 1910 General Election
 Frederick H. Gillett(I)
14,242
48.78%
 William G. McKechnie
13,774
47.18%
 Alva E. Fenton
1,177
4.03%
  Others
1
0.00%
Nov 03, 1908 General Election
 Frederick H. Gillett(I)
17,515
62.01%
 John L. Rice
7,839
27.75%
 George W. Curtis
1,623
5.75%
 Joseph Orr
1,266
4.48%
  Others
1
0.00%
Nov 06, 1906 General Election
 Frederick H. Gillett(I)
15,873
61.27%
 Edward A. Hall
8,412
32.47%
 George H. Wrenn
1,622
6.26%
Nov 08, 1904 General Election
 Frederick H. Gillett(I)
17,611
63.53%
 George W. Wheelwright Jr.
7,992
28.83%
 George H. Wrenn
1,744
6.29%
 Alfred E. Steele
374
1.35%
Nov 04, 1902 General Election
 Frederick H. Gillett(I)
14,067
58.05%
 Arthur F Nutting
6,998
28.88%
 George H. Wrenn
2,779
11.47%
 Lucius E. Parsons
390
1.61%
Date Type Results
Nov 06, 1900 General Election
 Frederick H. Gillett(I)
17,604
60.85%
 Thomas W. Keneflick
10,666
36.87%
 Charles Rawbone
657
2.27%
  Others
1
0.00%
Nov 08, 1898 General Election
 Frederick H. Gillett(I)
13,327
60.33%
 Robert E. Bisbee
8,054
36.46%
 George H. Wrenn
707
3.20%
  Others
3
0.01%
Nov 03, 1896 General Election
 Frederick H. Gillett(I)
19,793
71.79%
 Thomas A. Fitzgibbon
7,778
28.21%
Date Type Results
Nov 06, 1894 General Election
 Frederick H. Gillett(I)
15,480
61.43%
 Edward A. Hall
7,924
31.44%
 George M. Stearns
1,050
4.17%
 Hubbard Lawrence
746
2.96%
Nov 08, 1892 General Election
 Frederick H. Gillett
15,131
52.41%
 Edward H. Lathrop
12,718
44.06%
 Herbert M. Small
1,019
3.53%
Date Type Results
Nov 04, 1890 General Election
 Elijah A. Morse(I)
12,339
52.26%
 Bushrod Morse
10,489
44.43%
 Thomas J. Lathrop
782
3.31%
Nov 06, 1888 General Election
 Elijah A. Morse
17,072
54.75%
 Josiah Quincy
13,388
42.94%
 William H. Phillips
719
2.31%
Nov 02, 1886 General Election
 John Davis Long(I)
11,317
52.38%
 Bushrod Morse
9,495
43.94%
 George W. Dyer
795
3.68%
Nov 04, 1884 General Election
 John Davis Long(I)
15,039
53.00%
 William Everett
9,734
34.30%
 Edgar E. Dean
2,630
9.27%
 George Buttrick
972
3.43%
Nov 07, 1882 General Election
 John Davis Long
12,915
53.94%
 Edgar E. Dean
10,152
42.40%
 John W. Willett
545
2.28%
 George E. Dunham
333
1.39%
Date Type Results
Nov 02, 1880 General Election
 Benjamin W. Harris(I)
17,047
62.81%
 Edgar E. Dean
9,718
35.81%
 Charles G. Davis
141
0.52%
 Joseph Sherman
118
0.43%
 Whitman Chace
116
0.43%
Nov 05, 1878 General Election
 Benjamin W. Harris(I)
14,579
58.75%
 Edgar E. Dean
5,472
22.05%
 Edward Avery
4,374
17.63%
 Thomas J. Lothrop
391
1.58%
Nov 07, 1876 General Election
 Benjamin W. Harris(I)
15,550
61.45%
 Edward Avery
9,757
38.55%
Date Type Results
Nov 03, 1874 General Election
 Benjamin W. Harris(I)
9,651
59.07%
 Edward Avery
6,688
40.93%
Nov 05, 1872 General Election
 Benjamin W. Harris
13,752
72.96%
 Edward Avery
5,096
27.04%
Date Type Results
Nov 08, 1870 General Election
 Oakes Ames(I)
9,367
60.15%
 Edward Avery
6,100
39.17%
 William W. Comstock
107
0.69%
Nov 03, 1868 General Election
 Oakes Ames(I)
14,498
71.80%
 Edward Avery
5,695
28.20%
Nov 06, 1866 General Election
 Oakes Ames(I)
9,581
79.60%
 Abijah M. Ide
2,456
20.40%
Date Type Results
Nov 08, 1864 General Election
 Oakes Ames(I)
13,591
72.07%
 James Maguire
5,266
27.93%
Nov 04, 1862 General Election
 Oakes Ames
9,271
61.08%
 William D. Swan
5,907
38.92%
Date Type Results
Nov 06, 1860 General Election
 James Buffinton(I)
10,103
68.40%
 Aaron Hobart
4,409
29.85%
  Scattering
258
1.75%
Nov 02, 1858 General Election
 James Buffinton(I)
7,385
71.52%
 John Wilson
2,941
28.48%
Nov 04, 1856 General Election
 James Buffinton(I)
11,658
72.39%
 Charles R. Vickery
3,314
20.58%
 Darius Dunbar
1,132
7.03%
Nov 12, 1854 General Election
 James Buffinton
8,064
68.25%
 Samuel L. Crocker(I)
1,914
16.20%
 Charles R. Vickery
1,064
9.00%
 Gersham B. Weston
774
6.55%
Dec 13, 1852 General Election
 Samuel L. Crocker
3,599
46.19%
 Gersham B. Weston
3,455
44.34%
 Abijah M. Ide
738
9.47%
Date Type Results
Dec 13, 1852 Special Election
 Francis B. Fay
4,989
47.32%
 George Hood
4,821
45.73%
 George Osborne
420
3.98%
 Nathaniel J. Lord
313
2.97%
Date Type Results
Nov 08, 1852 Primary Election
 Francis B. Fay
5,838
43.55%
 John Bassett Alley
3,365
25.10%
 George Hood
2,882
21.50%
 George Osborne
873
6.51%
 Nathaniel J. Lord
448
3.34%
Nov 08, 1852 Primary Election
 Samuel L. Crocker
5,150
39.70%
 Gersham B. Weston
4,302
33.17%
 Abijah M. Ide
3,228
24.89%
 William H. Lampson
291
2.24%
Date Type Results
May 26, 1851 General Election
 Robert Rantoul
7,183
51.43%
 Charles W. Upham
6,089
43.60%
 Benjamin F. Brown
694
4.97%
Apr 07, 1851 Primary Election
 Charles W. Upham
4,251
45.58%
 Robert Rantoul
3,151
33.78%
 Samuel Sewall
1,773
19.01%
 Benjamin F. Brown
152
1.63%
Jan 20, 1851 Primary Election
 Charles W. Upham
4,125
47.96%
 Robert Rantoul
2,846
33.09%
 Samuel Sewall
1,630
18.95%
Jan 20, 1851 Primary Election
 Charles W. Upham
4,122
47.98%
 Robert Rantoul
2,839
33.05%
 Samuel Sewall
1,630
18.97%
Nov 11, 1850 Primary Election
 Charles W. Upham
6,013
43.78%
 Robert Rantoul
4,739
34.50%
 Samuel Sewall
2,984
21.72%
Nov 11, 1850 Primary Election
 Charles W. Upham
5,862
44.39%
 Robert Rantoul
4,364
33.05%
 Samuel Sewall
2,979
22.56%
Sep 09, 1850 Primary Election
 Charles W. Upham
4,499
48.65%
 Robert Rantoul
3,303
35.72%
 John Pierpont
1,446
15.64%
Aug 19, 1850 Primary Election
 Charles W. Upham
3,380
49.41%
 Robert Rantoul
2,270
33.18%
 John Pierpont
1,191
17.41%
Jan 01, 1849 General Election
 Daniel P. King(I)
4,201
54.62%
 Benjamin F. Newhall
1,903
24.74%
 Robert Rantoul
1,588
20.64%
Nov 13, 1848 Primary Election
 Daniel P. King(I)
6,312
45.30%
 Caleb Stetson
4,075
29.25%
 Robert Rantoul
3,547
25.46%
Dec 28, 1846 General Election
 Daniel P. King
3,735
62.63%
 George W. Dike
1,621
27.18%
 Lemuel Gott
427
7.16%
  Scattering
181
3.03%
Nov 09, 1846 Primary Election
 Daniel P. King(I)
4,636
49.94%
 George W. Dike
2,773
29.87%
 Lemuel Gott
1,261
13.58%
 Increase H. Brown
562
6.05%
  Scattering
51
0.55%
Dec 23, 1844 General Election
 Daniel P. King(I)
4,986
57.69%
 George Hood
2,770
32.05%
 Henry B. Stanton
886
10.25%
Nov 11, 1844 Primary Election
 Daniel P. King(I)
6,659
49.84%
 George Hood
5,211
39.00%
 Henry B. Stanton
1,491
11.16%
Jun 05, 1843 General Election
 Daniel P. King
3,711
51.36%
 Jeremiah C. Stickney
2,854
39.50%
 Moses P. Hanson
660
9.13%
Apr 03, 1843 Primary Election
 Robert Rantoul
4,624
45.38%
 Daniel P. King
4,480
43.96%
 Moses P. Hanson
770
7.56%
 David Pingree
316
3.10%
Feb 13, 1843 Primary Election
 Robert Rantoul
4,979
49.09%
 Leverett Saltonstall
3,967
39.11%
 David H. Barlow
743
7.33%
 David Pingree
303
2.99%
 Stephen Clarendon Phillips
151
1.49%
Nov 14, 1842 Primary Election
 Robert Rantoul
5,403
46.88%
 Leverett Saltonstall(I)
4,928
42.76%
 William B. Dodge
839
7.28%
 David Pingree
356
3.09%
Date Type Results
Nov 09, 1840 General Election
 Leverett Saltonstall(I)
6,153
59.00%
 Robert Rantoul
4,276
41.00%
Nov 12, 1838 General Election
 Leverett Saltonstall
3,734
59.26%
 Robert Rantoul
2,031
32.23%
 Joseph S. Cabot
536
8.51%
Nov 12, 1838 Special Election
 Leverett Saltonstall
3,730
59.15%
 Robert Rantoul
2,034
32.25%
 Joseph S. Cabot
542
8.59%
Nov 14, 1836 General Election
 Stephen Clarendon Phillips(I)
3,920
51.11%
 Joseph S. Cabot
3,749
48.89%
Nov 10, 1834 General Election
 Stephen Clarendon Phillips
4,230
60.31%
 Joseph S. Cabot
2,784
39.69%
Nov 10, 1834 Special Election
 Stephen Clarendon Phillips
4,245
60.44%
 Joseph S. Cabot
2,778
39.56%
Apr 01, 1833 General Election
 Rufus Choate(I)
2,216
59.19%
 Joseph S. Cabot
1,204
32.16%
 William B. Breed
324
8.65%
Date Type Results
Nov 01, 1830 General Election
 Rufus Choate
1,740
59.12%
 Benjamin W. Crowninshield(I)
767
26.06%
  Scattering
436
14.81%
Nov 07, 1828 General Election
 Benjamin W. Crowninshield(I)
1,326
54.64%
 Leverett Saltonstall
631
26.00%
 Ezra Mudge
284
11.70%
 Joseph S. Cabot
186
7.66%
Nov 06, 1826 General Election
 Benjamin W. Crowninshield(I)
234
58.94%
  Scattering
124
31.23%
 Stephen White
39
9.82%
Nov 01, 1824 General Election
 Benjamin W. Crowninshield(I)
1,379
58.06%
 Frederick Howes
760
32.00%
  Scattering
236
9.94%
Mar 03, 1823 General Election
 Benjamin W. Crowninshield
1,312
51.86%
 Benjamin Merrill
693
27.39%
 Willard Peele
525
20.75%
Nov 04, 1822 Primary Election
 Benjamin W. Crowninshield
916
48.39%
 Benjamin Merrill
794
41.94%
 Willard Peele
183
9.67%
Date Type Results
Apr 16, 1821 General Election
 Gideon Barstow
1,345
53.91%
 Timothy Pickering
1,116
44.73%
  Scattering
34
1.36%
Jan 08, 1821 Primary Election
 Gideon Barstow
566
48.38%
 John Hooper
329
28.12%
 Willard Peele
118
10.09%
 Charles Saunders
106
9.06%
  Scattering
51
4.36%
Nov 06, 1820 Primary Election
 Willard Peele
659
38.54%
 Gideon Barstow
582
34.04%
 Leverett Saltonstall
469
27.43%
Date Type Results
Nov 02, 1818 General Election
 Nathaniel Silsbee(I)
652
64.24%
 Timothy Pickering
350
34.48%
 Thomas Stevens
13
1.28%
Nov 04, 1816 General Election
 Nathaniel Silsbee
1,437
50.53%
 Thomas Stevens
1,407
49.47%
Date Type Results
Nov 07, 1814 General Election
 Timothy Pickering(I)
1,261
89.24%
 Daniel Kilham
152
10.76%
Date Type Results
Nov 02, 1812 General Election
 William Reed(I)
2,403
56.09%
 Benjamin W. Crowninshield
1,881
43.91%
Date Type Results
Nov 05, 1810 General Election
 William Reed
1,709
53.61%
 Daniel Kilham
1,479
46.39%
Nov 07, 1808 General Election
 Benjamin Pickman
2,754
52.18%
 Daniel Kilham
2,524
47.82%
May 04, 1808 Special Election
 Joseph Story
1,939
100.00%
Nov 03, 1806 General Election
 Jacob Crowninshield(I)
1,483
54.95%
 Samuel Peterson
1,216
45.05%
Nov 05, 1804 General Election
 Jacob Crowninshield(I)
1,884
58.75%
 Nathan Read
1,323
41.25%
Nov 01, 1802 General Election
 Jacob Crowninshield
1,400
51.93%
 Timothy Pickering
1,296
48.07%
Date Type Results
Nov 03, 1800 General Election
 William Shepard(I)
1,142
73.35%
  Scattering
215
13.81%
 William Lyman
200
12.85%
Nov 05, 1798 General Election
 William Shepard(I)
1,032
87.02%
 William Lyman
118
9.95%
  Scattering
36
3.04%
Jan 16, 1797 General Election
 William Shepard
1,601
100.00%
Nov 07, 1796 Primary Election
 William Shepard
823
46.31%
 Sam Hinshaw
424
23.86%
 William Lyman(I)
381
21.44%
 John Williams
71
4.00%
  Scattering
43
2.42%
 Nahum Park
35
1.97%
Nov 03, 1794 General Election
 William Lyman(I)
774
50.82%
 William Shepard
713
46.82%
 John Williams
22
1.44%
  Scattering
14
0.92%
Date Type Results
Oct 04, 1790 General Election
 Benjamin Goodhue(I)
1,027
86.89%
 Samuel Holten
129
10.91%
 Azor Orne
9
0.76%
 Nathan Dane
6
0.51%
 Theophilus Parsons
6
0.51%
 Daniel Kilham
3
0.25%
 Samuel Sewall
2
0.17%
No Map In System
Date Type Results
Jan 29, 1789 General Election
 Benjamin Goodhue
1,491
67.10%
 Jonathan Jackson
724
32.58%
 Samuel Holten
3
0.14%
 Daniel Killborn
3
0.14%
 Nathan Dane
1
0.05%
Dec 18, 1788 Primary Election
 Benjamin Goodhue
567
38.60%
 Jonathan Jackson
392
26.68%
 Nathan Daneseg
295
20.08%
 Samuel Holten
202
13.75%
 Samuel Phillips
10
0.68%
 Jonathan Titcomb
2
0.14%
 George Cabot
1
0.07%

DISCUSSION
[Download as CSV]